A Complementary Color Wavelet-based Measure on Color Image Sharpness Assessment for Autofocus
-
摘要: 针对彩色图像的自动聚焦, 本文提出了一种新的清晰度评价测度. 该测度借助于互补色小波变换, 在互补色小波域, 利用融合互补色算子的层级最大能量和层级统计分布扩散度的乘积来描述本文的清晰度. 分析表明: 融合互补色算子, 可提取待评价彩色图像在颜色、亮度、方向、尺度和各通道分量间的相互信息等方面的相关特征. 这样, 其层级的最大能量就反映了这些被提取相关特征中最显著特征的清晰程度, 而其统计分布的扩散度, 就衡量了其清晰度特征分布的离散程度. 那么利用它们来共同表征清晰度的测度, 就使得本文所提的测度能随图像清晰程度的增加而增加. 在LIVE/IVC数据库上与多种经典方法的对比结果表明: 本文提出的测度具有最高的聚焦精度0.0373/0.0246、分辨率1.6132/0.4771和最好的无偏稳定性.Abstract: In this paper, a new measure on color image sharpness assessment for autofocus is proposed. By means of the complementary color wavelet transform (CCWT), the scale maximum energy and statistical distribution variabilities of the fusion complementary color operators in CCWT domain are combined into an image sharpness assessment measure by their product. The analyses show that the complementary color operators can extract the characteristics of the color, brightness, scales, directions and mutual information among the channels in a color image. In this way, the sharpness of the most significant feature in these extracted characteritics is revealed by the scale maximum energy of the complementary color operators. The dispersion degree of the features related to the sharpness of an image is disclosed by the distribution variabilities of the operators. As a result, the proposed measure in this paper can increase with the increase of the image sharpness. The simulation results on the LIVE/IVC database show that the proposed measure is of the highest focusing accuracy 0.0373/0.0246 and resolution 1.6132/0.4771, and the best unbiased stability comparison with the classical methods reported in literature.
-
Key words:
- Sharpness assessment /
- complementary color wavelet /
- color image /
- maximum energy /
- variability
-
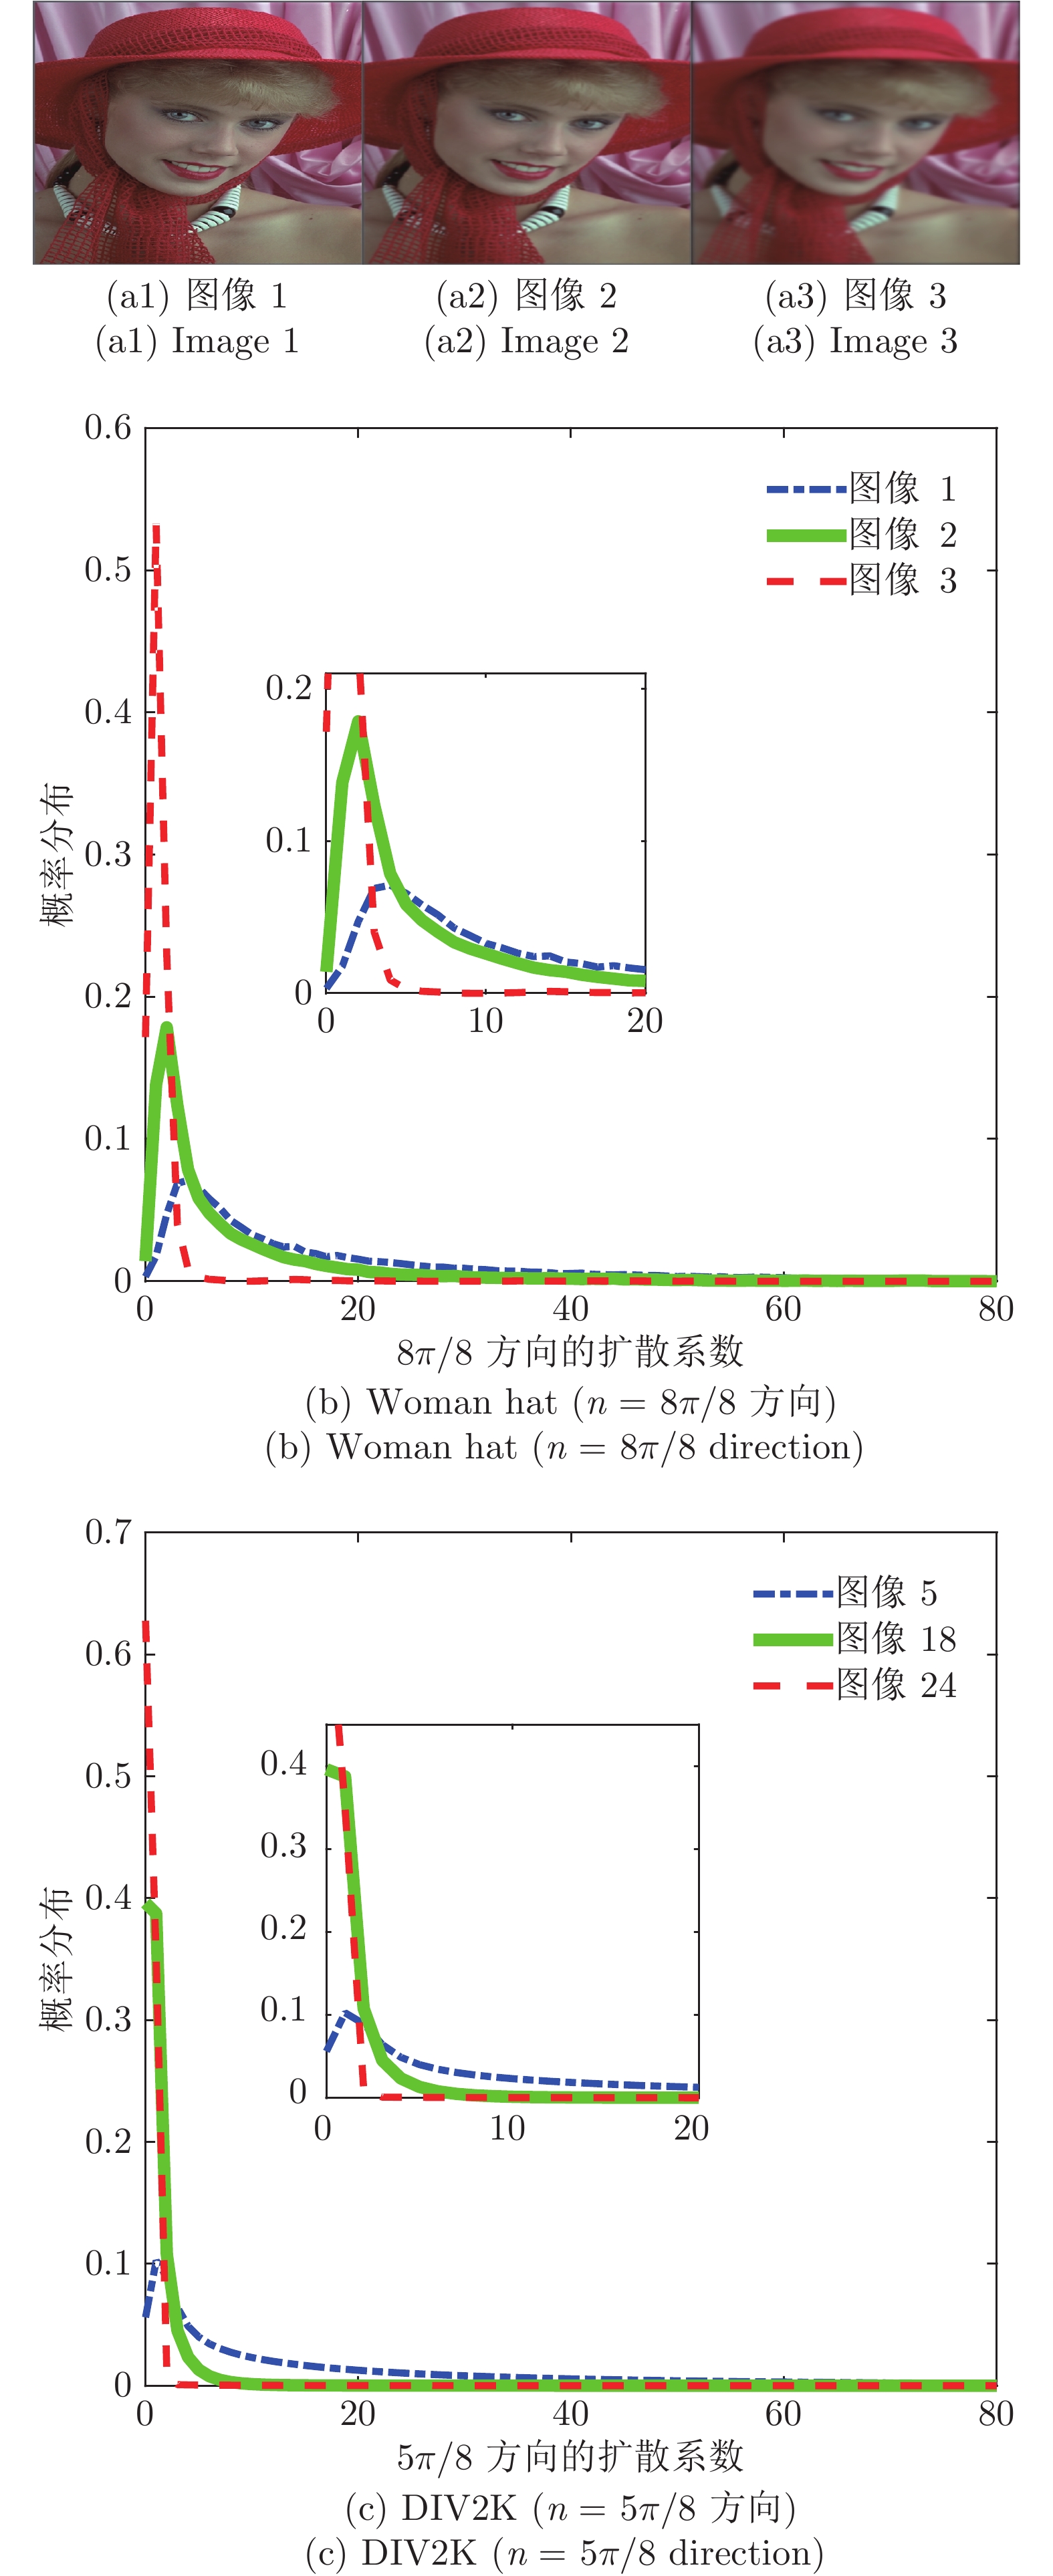
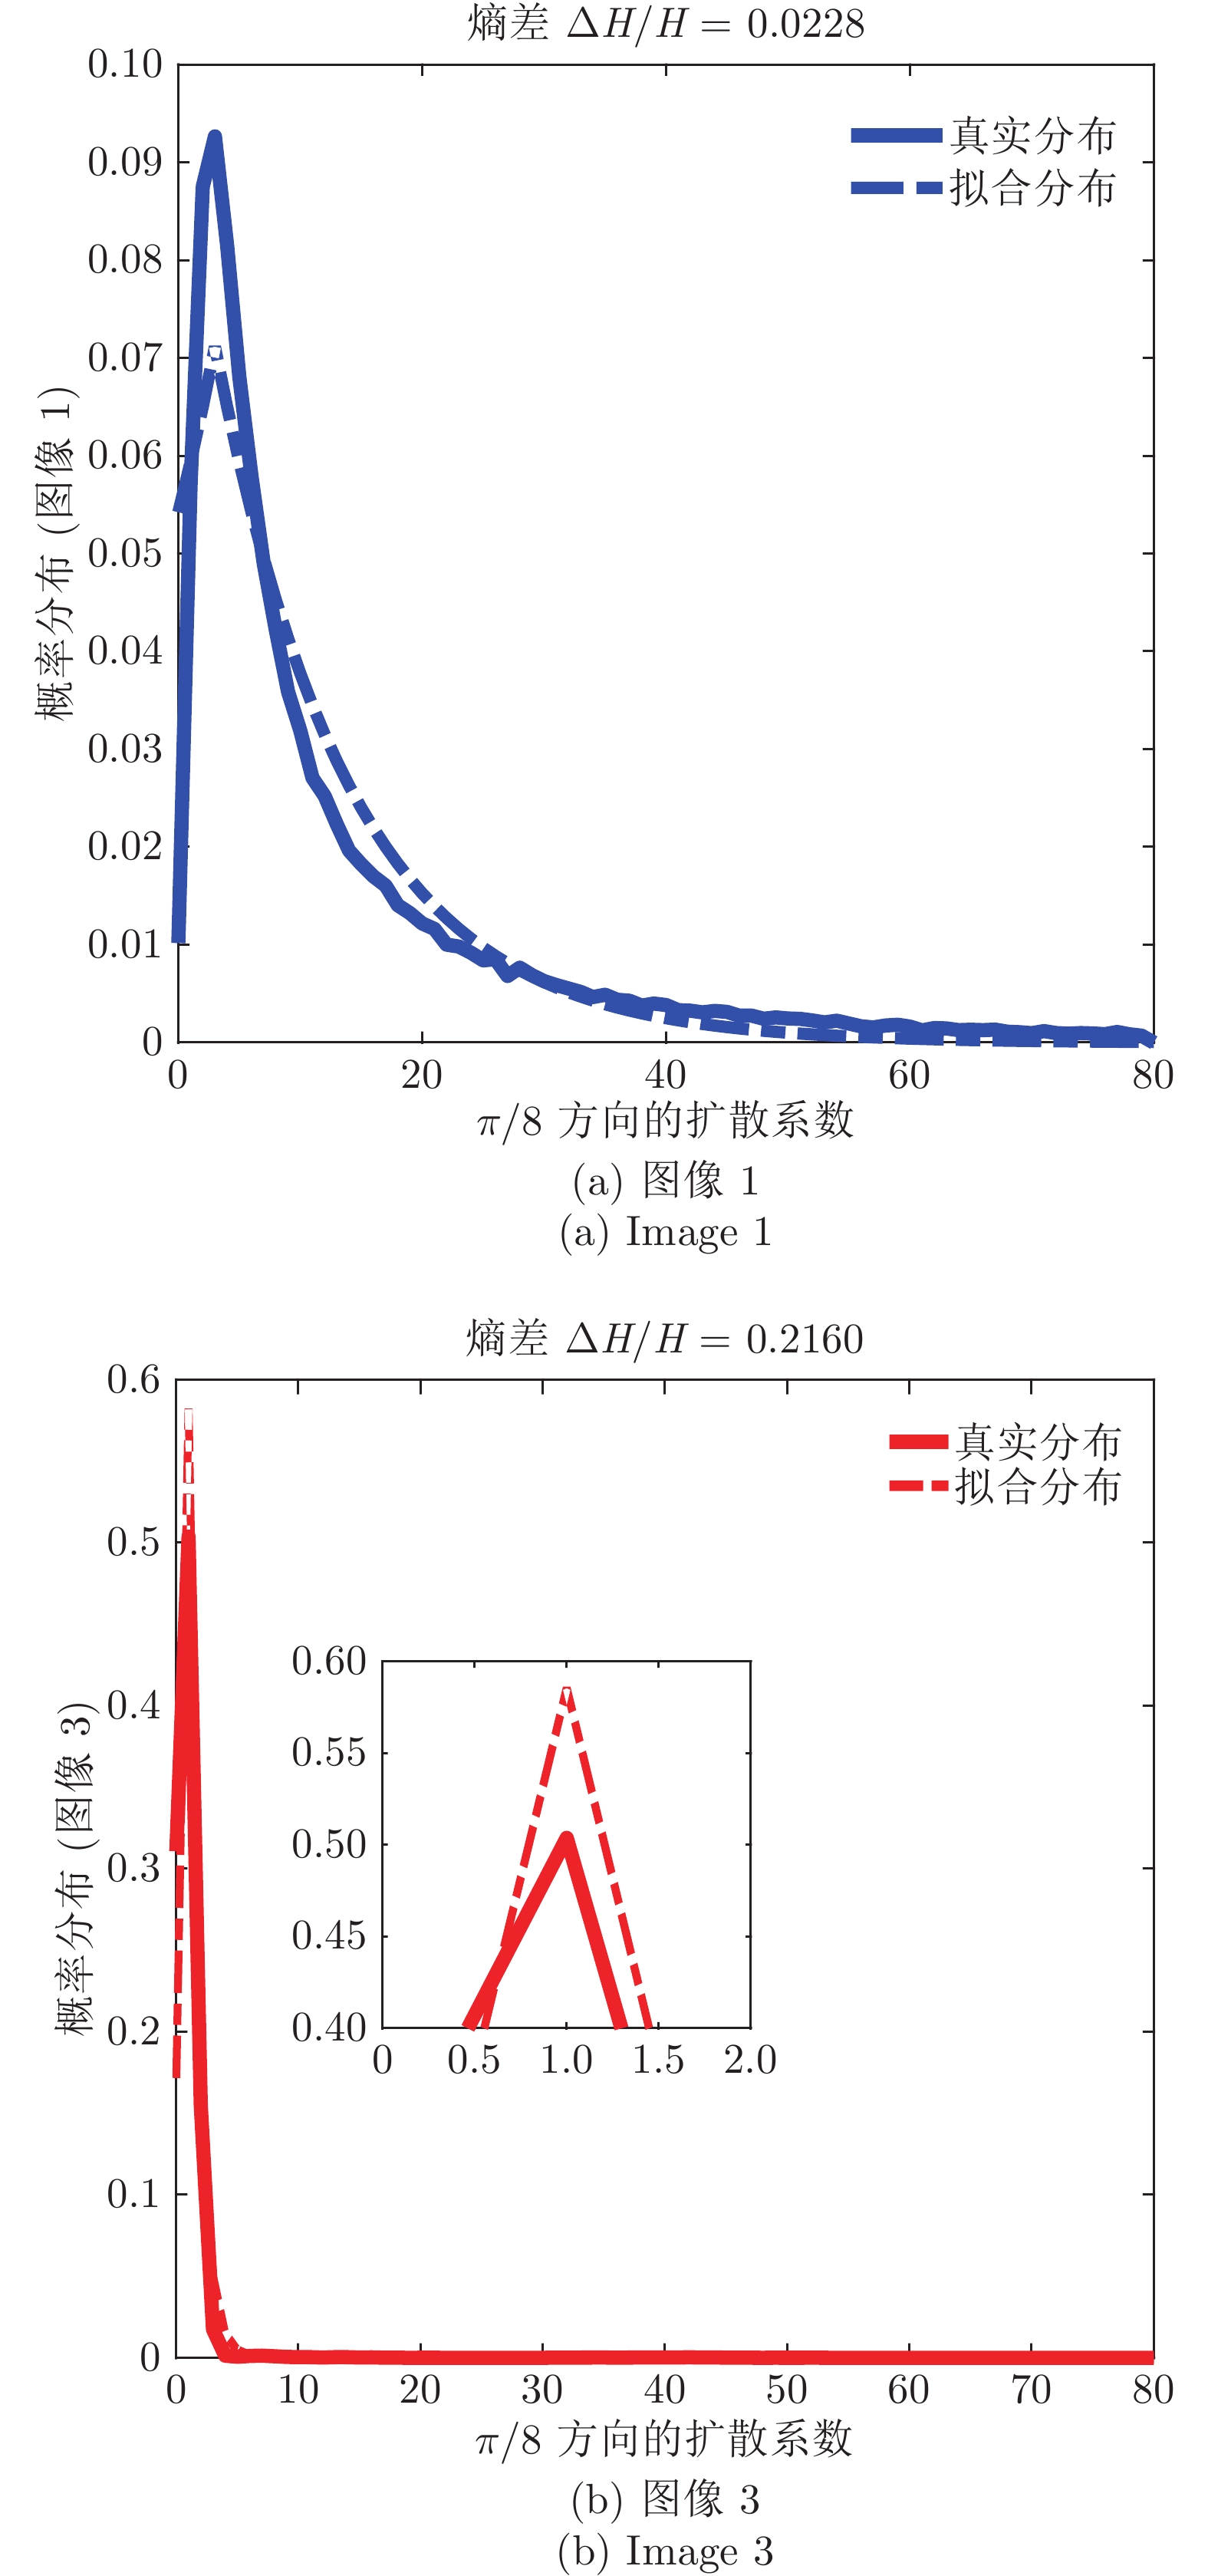
图 7 Woman hat图像1和图像3在第1层级、方向为
$n = \pi /8$ 的扩散系数集合统计的真实分布及拟合分布(实线为真实分布, 虚线为拉普拉斯拟合分布)Fig. 7 Empirical and fitting distribution of diffusion coefficients of woman hat image 1 and image 3 with direction
$n = \pi /8$ in level 1 (The solid line is the empirical distribution, and the dashed line is the Laplace fitting distribution)表 1 图像高斯模糊的方差及窗口大小
Table 1 The variance and window size of image Gaussian blur
图像 $\sigma _h^2 $ 窗口大小 图像 $\sigma _h^2 $ 窗口大小 1 0.28 3 13 0.964 7 2 0.29 3 14 1 7 3 0.3 3 15 1.1 7 4 0.32 3 16 1.2 9 5 0.33 3 17 1.33 9 6 0.34 3 18 1.67 11 7 0.35 3 19 2 13 8 0.4 3 20 2.33 15 9 0.5 3 21 2.67 17 10 0.66 5 22 3 19 11 0.8 5 23 3.33 21 12 0.906 7 24 3.67 23 表 2 DIV2K中层级1、方向为
$n = 4\pi /8$ 的子带的真实分布与拟合分布熵差Table 2 In DIV2K, the entropy difference between the empirical distribution and the fitting distribution of the subband with direction
$n = 4\pi /8$ in level 1图像 $\Delta H/H$ 图像 $\Delta H/H$ 1 0.0254 13 0.0278 2 0.0253 14 0.0281 3 0.0252 15 0.0290 4 0.0246 16 0.0303 5 0.0243 17 0.0225 6 0.0239 18 0.0367 7 0.0235 19 0.0415 8 0.0224 20 0.0681 9 0.0241 21 0.1853 10 0.0259 22 0.4329 11 0.0265 23 0.8159 12 0.0274 24 1.2271 表 3 各清晰度评价算法在LIVE数据库gblur图像序列中的聚焦精度和分辨率均值(e = 1%)
Table 3 The average of accuracy metrics and resolution metrics of each sharpness assessment method in Gaussian blur image sequences of LIVE (gblur) database (e = 1%)
Methods 精度(AM) 精度提升(%) 分辨率(RM) 分辨率提升(%) Entropy[3] 5.4621 99.32 9.0081 82.09 Tenengrad[6] 0.1130 66.99 6.1262 73.67 SMD[8] 0.0756 50.66 6.1054 73.58 SML[9] 0.0543 31.31 3.2748 50.74 Variance[15] 0.5798 93.57 8.6133 81.27 Sd-Svd[11] 0.0380 1.84 2.1322 24.34 DB[15] 0.0950 0.74 6.5152 75.24 FISH[14] 0.0636 41.35 3.9004 58.64 MDB 0.0407 8.35 2.4862 35.11 MCCWT 0.0373 − 1.6132 − 表 4 各清晰度评价算法在IVC数据库Flou图像序列中的聚焦精度和分辨率均值(e = 1%)
Table 4 The average of accuracy metrics and resolution metrics of each sharpness assessment method in Gaussian blur image sequences of IVC (Flou) database (e = 1%)
Methods 精度(AM) 精度提升(%) 分辨率(RM) 分辨率提升(%) Entropy[3] 2.5343 99.03 9.1027 94.47 Tenengrad[6] 0.0785 68.66 6.2105 92.32 SMD[8] 0.0517 52.42 6.0649 92.13 SML[9] 0.0323 23.84 1.7217 72.29 Variance[15] 0.4067 93.95 8.7291 94.53 Sd-Svd[11] 0.0265 7.17 2.2631 78.92 DB[15] 0.0645 61.86 6.4927 92.65 FISH[14] 0.0404 39.11 2.8601 83.32 MDB 0.0299 17.73 1.6301 70.73 MCCWT 0.0246 − 0.4771 − 表 5 各清晰度评价算法在LIVE数据库gblur图像序列中的最大值错误次数(噪声存在于图像2)
Table 5 The number of errors in the maximum value of each sharpness assessment method in the Gaussian blur image sequence of LIVE (gblur) database (noise in image 2)
表 6 各清晰度评价算法在LIVE数据库gblur图像序列中的最大值错误次数(噪声存在于图像3)
Table 6 The number of errors in the maximum value of each sharpness assessment method in the Gaussian blur image sequence of LIVE (gblur) database (noise in image 3)
表 7 各清晰度评价算法在LIVE数据库gblur图像序列中的最大值错误次数(噪声存在于图像4)
Table 7 The number of errors in the maximum value of each sharpness assessment method in the Gaussian blur image sequence of LIVE (gblur) database (noise in image 4)
表 8 各清晰度评价算法在LIVE数据库gblur图像序列中的平均运行时间
Table 8 Average running time of each sharpness assessment method in LIVE (gblur) database
-
[1] 谢攀, 张利, 康宗明, 谢时根. 一种基于尺度变化的DCT自动聚焦算法. 清华大学学报(自然科学版), 2003, 43(1): 55−58 doi: 10.3321/j.issn:1000-0054.2003.01.017Xie Pan, Zhang Li, Kang Zong-Ming, Xie Shi-Gen. Window scale-based automatic focus algorithm using DCT transformation. Journal of Tsinghua University (Science and Technology), 2003, 43(1): 55−58 doi: 10.3321/j.issn:1000-0054.2003.01.017 [2] 康宗明, 张利, 谢攀. 一种基于能量和熵的自动聚焦算法. 电子学报, 2003, 31(4): 552−555 doi: 10.3321/j.issn:0372-2112.2003.04.020Kang Zong-Ming, Zhang Li, Xie Pan. Implementation of an automatic focusing algorithm based on spatial high frequency energy and entropy. Acta Electronica Sinica, 2003, 31(4): 552−555 doi: 10.3321/j.issn:0372-2112.2003.04.020 [3] 贾旭, 曹玉东, 孙福明, 崔建江, 薛定宇. 基于无参考质量评价模型的静脉图像采集方法. 电子学报, 2015, 43(2): 236−241 doi: 10.3969/j.issn.0372-2112.2015.02.005Jia Xu, Cao Yu-Dong, Sun Fu-Ming, Cui Jian-Jiang, Xue Ding-Yu. Vein image acquisition method based on quality assessment model without reference. Acta Electronica Sinica, 2015, 43(2): 236−241 doi: 10.3969/j.issn.0372-2112.2015.02.005 [4] Firestone L, Cook K, Culp K, Talsania N, Preston K. Comparison of autofocus methods for automated microscopy. Cytometry, 1991, 12(3): 195−206 doi: 10.1002/cyto.990120302 [5] Choi K S, Lee J S, Ko S J. New autofocusing technique using the frequency selective weighted median filter for video cameras. IEEE Transactions on Consumer Electronics, 1999, 45(3): 820−827 doi: 10.1109/30.793616 [6] Tenenbaum J M. Accummodation in Computer Vision, [Ph. D. dissertation], Stanford University, USA, 1970 [7] Zhan Y B, Zhang R. No-Reference image sharpness assessment based on maximum gradient and variability of Gradients. IEEE Transactions on Multimedia, 2018, 20(7): 1796−1808 [8] Jarvis R A. Focus optimization criteria for computer image processing. Microscope, 1976, 24(2): 163−180 [9] Nayar S K, Nakagawa Y. Shape from focus system. IEEE Tansactions Pattern Analysis and Machine Intelligence, 1994, 16(8): 824−831 doi: 10.1109/34.308479 [10] 李郁峰, 陈念年, 张佳成. 一种快速高灵敏度聚焦评价函数. 计算机应用研究, 2010, 27(4): 1534−1536Li Yu-Feng, Chen Nian-Nian, Zhang Jia-Cheng. Fast and high sensitivity focusing evaluation function. Application Research of Computers, 2010, 27(4): 1534−1536 [11] Li Y J, Di X G. A no-reference infrared image sharpness assessment based on singular value decomposition. In: Proceedings of the 2016 Visual Communication and Image Processing. Chengdu China: IEEE, 2016. 1−4 [12] Baina J, Dublet J. Automatic focus and iris control for video cameras. In Proceedings of the Fifth International Conference Image Processing and its Applications. Edinburgh, UK: IEEE, 1995, 232−235 [13] 菅维乐, 姜威, 周贤. 一种基于小波变换的数字图像自动聚焦算法. 山东大学学报: 工学版, 2004, 34(6): 38−40Jian Wei-Le, Jiang Wei, Zhou Xian. Auto-focusing algorithms of aigital image based on wavelet transform. Journal of Shandong University (Engineering Science), 2004, 34(6): 38−40 [14] Vu P V, Chandler D M. A fast wavelet-based algorithm for global and local image sharpness estimation. IEEE Signal Processing Letters. 2012, 19(7): 423−426 [15] 王义文, 刘献礼, 谢晖. 基于小波变换的显微图像清晰度评价函数及3-D自动调焦技术. 光学精密工程, 2006, 14(6): 1063−1069 doi: 10.3321/j.issn:1004-924X.2006.06.023Wang Yi-Wen, Liu Xian-Li, Xie Hui. A wavelet-based focus measure and 3-D autofocusing for microscope images. Optics and Precision Engineering, 2006, 14(6): 1063−1069 doi: 10.3321/j.issn:1004-924X.2006.06.023 [16] Fan Z G, Chen S Q. Autofocus algorithm based on wavelet packet transform for infrared microscopy. In: Proceedings of the 3rd International Congress on Image and Signal Processing, Yantai, China: IEEE, 2010. 2510−2514 [17] Zhang Z, Liu Y, Tan H. No-reference image sharpness assessment using scale and directional models. In: Proceedings of the 2018 IEEE International Conference on Multimedia & Expo. San Diego, CA, USA: IEEE, 2018. 1−6 [18] Weijer J V D, Gevers T, Bagdanov A D. Boosting color saliency in image feature detection. IEEE Transactions on Pattern Analysis and Machine Intelligence, 2005, 28(1): 150−156 [19] Chen Y, Li D, Zhang J Q. Complementary color wavelet: A novel tool for the color image/video analysis and processing. IEEE Transactions on Circuits and Systems for Video Technology, 2017, 29(1): 12−27 [20] MacAdam D L. Photometric relationships between complementary colors. Journal of the Optical Society of America, 1938, 28(4): 103−111 doi: 10.1364/JOSA.28.000103 [21] Pridmore R W. Complementary colors theory of color vision: Physiology, color mixture, color constancy and color perception. Color Research & Application, 2011, 36(6): 394−412 [22] Selesnick I W, Baraniuk R G, Kingsbury N C. The dual-tree complex wavelet transform. IEEE Signal Processing Magazine, 2005, 22(6): 123−151 doi: 10.1109/MSP.2005.1550194 [23] Born M, Wolf E, Principles of optics. London: Pergamon, 1965. [24] Pentland P A. A new sense for depth of field. pattern analysis and machine intelligence. IEEE Transactions on Pattern Analysis and Machine Intelligence, 1987, 9(4): 523−531 [25] 陈扬, 李旦, 张建秋. 互补色小波域图像质量盲评价方法. 电子学报, 2019, 47(4): 775−783 doi: 10.3969/j.issn.0372-2112.2019.04.002Chen Yang, Li Dan, Zhang Jian-Qiu. Blind image quality assessment with complementary color wavelet transform. Acta Electronica Sinica, 2019, 47(4): 775−783 doi: 10.3969/j.issn.0372-2112.2019.04.002 [26] 陈扬, 张建秋. 互补色小波域自然场景统计显著图模型. 微电子学与计算机, 2019, 36(3): 17−22, 27Chen Yang, Zhang Jian-Qiu. A naturel scene statistical saliency map model in complementary color wavelet domain. Microelectronics & Computer, 2019, 36(3): 17−22, 27 [27] Ninassi A, Autrusseau F, Callet P L. Pseudo no reference image quality metric using perceptual data hiding. In: Proceedings of the International Society for Optical and Engineering. California, USA: SPIE, 2006. [28] Timofte R, Agustsson E, Gool L V. NTIRE 2017 challenge on single image super-resolution: methods and results. In: Proceedings of the 2017 IEEE Conference on Computer Vision and Pattern Recognition Workshops (CVPRW). Honolulu, HI, USA: IEEE, 2017. 1110−1121 [29] 苑津莎, 张冬雪, 李中. 基于改进阈值法的小波去噪算法研究. 华北电力大学学报, 2010, 37(5): 92−97Yuan Jin-Sha, Zhang Dong-Xue, Li Zhong. Wavelet denosing algorithm based on improved thresholding method. Joumal of North China Electric Power University, 2010, 37(5): 92−97 [30] Sendur L, Selesnick I W. Bivariate shrinkage functions for wavelet-based denoising exploiting interscale dependency. IEEE Transactions on Signal Processing, 2002, 50(11): 2744−2756 doi: 10.1109/TSP.2002.804091 [31] Sheikh H R, Wang Z, Cormack L, et al. LIVE image quality assessment database release 2(2005)[Online], available: http://live.ece.utexas.edu/research/quality/, September1, 2011 [32] 方开泰, 许建伦. 统计分布. 北京: 科学出版社, 1987. 277−282.Fang Kai-Tai, Xu Jian-Lun. Statistical Distribution. Beijing Science Press, 1987. 277−282 [33] 刘兴宝, 袁道成. 基于纹理分析的小波变换图像清晰度评价方法研究. 仪器仪表学报, 2007, 28(8): 1508−1513Liu Xin-Bao, Yuan Dao-Cheng. Research on image definition criterion using wavelet transform based on the tex ture analysis. Chinese Journal of Scientific Instrument, 2007, 28(8): 1508−1513 -


 下载:
下载:
