-
摘要: 现有子空间聚类方法通常以数据全局线性为前提,将每个样本点表示为其他样本点的线性组合,因而导致常见子空间聚类方法不能很好地应用于非线性数据.为克服全局线性表示的局限,借鉴流形学习思想,用k近邻局部线性表示代替全局线性表示,与稀疏子空间聚类和最小二乘子空间聚类方法相结合,提出局部稀疏子空间聚类和局部最小二乘子空间聚类方法,统称局部子空间聚类方法.在双月形数据、6个图像数据集和4个基因表达数据集上进行实验,实验结果表明该方法是有效的.Abstract: Existing subspace clustering methods usually rest on a global linear data set, which expresses each data point as a linear combination of all other data points, and thus common methods are not well suited for the nonlinear data. To overcome this limitation, the local sparse subspace clustering and local least squares regression subspace clustering are proposed. The idea of the two new methods comes from manifold learning which expresses each data point as a linear combination of its k nearest neighbors, and is combined with sparse subspace clustering and least squares subspace clustering respectively. Experimental results show that our method is effective on two-moon synthetic data, six image data sets and four gene expression data sets.
-
Key words:
- Local linear /
- k nearest neighbors /
- subspace clustering /
- image data /
- gene expression data
-
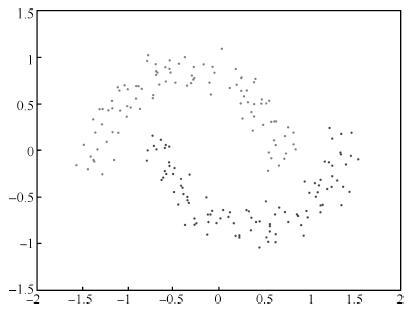
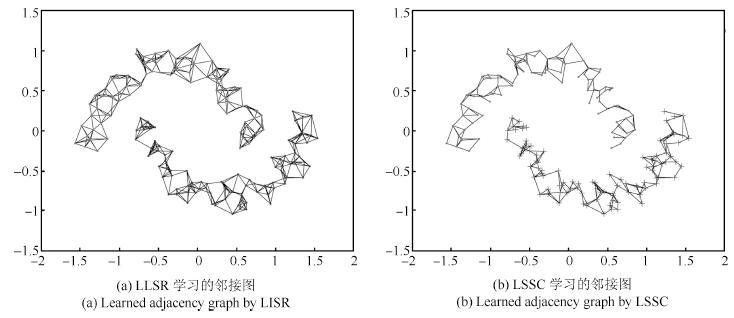
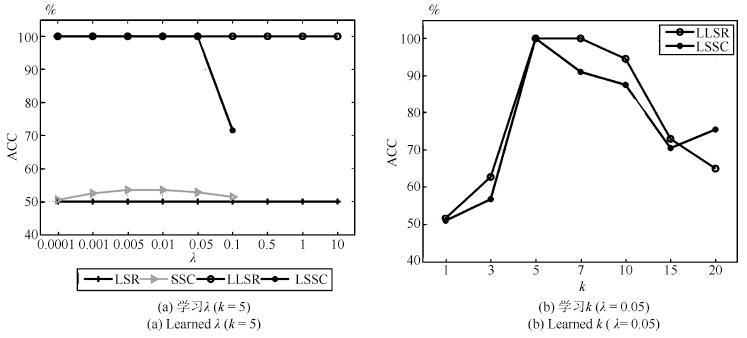
表 1 双月形数据上聚类准确率(%)和运行时间(s)的对比
Table 1 Clustering accuracy (%) and running time (s)comparison on the two-moon synthetic data
HC K-means LRR SSC LSR BD-LRR RLLRR SMR LSSC LLSR ACC 100.00 72.00 53.50 53.50 50.00 50.00 52.00 51.50 100.00 100.00 (0.001) (0.005) (0.0001) (0.08) (0.1) (0.001) (0.0001,5) (0.0001,5) Time 0.0010 0.0026 1.89 4.80 0.0008 19.15 0.33 0.045 0.94 0.10 表 2 数据集描述
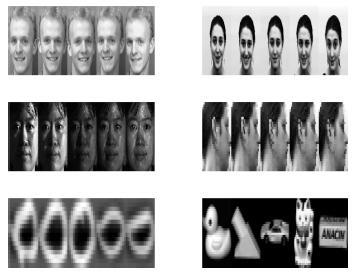
Table 2 Summary of the data sets
数据集 样本 长 宽 类别 ORL10P 100 112 92 10 PIX10P 100 100 100 10 PIE10P 210 55 44 10 Umist 575 28 23 20 USPS 1 000 16 16 10 COIL20 1 440 32 32 20 表 3 聚类准确率
Table 3 Clustering accuracy (%)
HC K-means LRR SSC LSR BD-LRR RLLRR SMR LSSC LLSR ORL10P 41.00 73.40 79.00 71.00 83.00 70.30 74.70 78.00 86.00 87.00 PIX10P 77.00 79.90 87.00 86.00 85.00 76.80 56.10 88.00 96.00 97.00 PIE10P 70.95 32.95 100.00 90.00 90.00 80.00 79.43 100.00 98.57 100.00 Umist 45.57 47.58 52.17 61.57 52.35 48.35 50.96 69.91 76.87 74.09 USPS 10.90 73.14 78.60 60.80 71.30 63.90 65.50 77.10 81.20 91.20 COIL20 53.47 60.10 65.69 72.01 63.40 67.72 68.80 67.15 78.26 79.58 表 4 运行时间的对比(s)
Table 4 Running time (s) comparison
HC K-means LRR SSC LSR BD-LRR RLLRR SMR LSSC LLSR ORL10P 0.0011 0.0071 0.54 0.21 0.00078 7.29 1.69 0.014 0.14 0.034 PIX10P 0.00095 0.0062 1.04 0.33 0.00073 7.60 1.72 0.012 1.25 0.035 PIE10P 0.0023 0.011 4.51 2.53 0.0015 22.23 2.14 0.057 0.32 0.13 Umist 0.011 0.037 25.14 62.27 0.015 240.70 13.48 0.71 1.52 0.92 USPS 0.034 0.091 130.61 124.57 0.044 884.42 120.33 4.53 3.57 2.75 COIL20 0.072 0.071 423.54 2.51 1446.67 926.78 134.86 18.92 18.97 5.69 表 5 数据集描述
Table 5 Summary of the data sets
数据集 样本 基因 类别 Leukemia1 72 5 327 3 SRBCT 83 2 308 4 Lung_Cancer 203 12 600 5 Prostate_Tumor 102 10 509 2 表 6 聚类准确率(%)
Table 6 Clustering accuracy (%)
HC K-means LRR SSC LSR BD-LRR RLLRR SMR LSSC LLSR Leukemia1 54.17 69.31 86.11 58.33 77.78 79.17 54.17 77.78 90.28 90.28 SRBCT 36.14 53.73 68.43 40.12 54.22 60.24 46.99 63.68 74.70 74.46 Lung_Cancer 78.33 83.50 87.39 83.74 92.61 85.22 84.24 90.64 91.63 92.61 Prostate_Tumor 51.96 63.73 62.75 56.86 62.75 60.78 60.78 59.80 66.67 69.61 -
[1] Yang A Y, Wright J, Ma Y, Sastry S S. Unsupervised segmentation of natural images via lossy data compression. Computer Vision and Image Understanding, 2008, 110(2):212-225 doi: 10.1016/j.cviu.2007.07.005 [2] Vidal R, Tron R, Hartley R. Multiframe motion segmentation with missing data using power factorization and GPCA. International Journal of Computer Vision, 2008, 79(1):85-105 doi: 10.1007/s11263-007-0099-z [3] 王卫卫, 李小平, 冯象初, 王斯琪. 稀疏子空间聚类综述. 自动化学报, 2015, 41(8):1373-1384 http://www.aas.net.cn/CN/abstract/abstract18712.shtmlWang Wei-Wei, Li Xiao-Ping, Feng Xiang-Chu, Wang Si-Qi. A survey on sparse subspace clustering. Acta Automatica Sinica, 2015, 41(8):1373-1384 http://www.aas.net.cn/CN/abstract/abstract18712.shtml [4] Hong W, Wright J, Huang K, Ma Y. Multiscale hybrid linear models for lossy image representation. IEEE Transactions on Image Processing, 2006, 15(12):3655-3671 doi: 10.1109/TIP.2006.882016 [5] Vidal R, Favaro P. Low rank subspace clustering (LRSC). Pattern Recognition Letters, 2014, 43:47-61 doi: 10.1016/j.patrec.2013.08.006 [6] Elhamifar E, Vidal R. Sparse subspace clustering. In:Proceedings of the 2009 IEEE Conference on Computer Vision and Pattern Recognition (CVPR). Miami, FL, USA:IEEE, 2009.2790-2797 https://www.computer.org/csdl/proceedings/cvpr/2009/3992/00/index.html [7] Liu G C, Lin Z C, Yu Y. Robust subspace segmentation by low-rank representation. In:Proceedings of the 27th International Conference on Machine Learning (ICML). Haifa, Israel, 2010.663-670 [8] Lu C Y, Min H, Zhao Z Q, Zhu L, Huang D S, Yan S C. Robust and efficient subspace segmentation via least squares regression. In:Proceedings of the 12th European Conference on Computer Vision (ECCV). Florence, Italy:Springer, 2012.347-360 [9] Zhang H Y, Lin Z C, Zhang C, Cao J B. Robust latent low rank representation for subspace clustering. Neurocomputing, 2014, 145:369-373 doi: 10.1016/j.neucom.2014.05.022 [10] Hu H, Lin Z C, Feng J J, Zhou J. Smooth representation clustering. In:Proceedings of the 2014 IEEE Conference on Computer Vision and Pattern Recognition (CVPR). Columbus, OH, USA:IEEE, 2014.3834-3841 [11] Soltanolkotabi M, Elhamifar E, Candés E J. Robust subspace clustering. The Annals of Statistics, 2014, 42(2):669-699 doi: 10.1214/13-AOS1199 [12] Feng J S, Lin Z C, Xu H, Yan S C. Robust subspace segmentation with block-diagonal prior. In:Proceedings of the 2014 IEEE Conference on Computer Vision and Pattern Recognition (CVPR). Columbus, OH, USA:IEEE, 2014.3818-3825 [13] Tibshirani R. Regression shrinkage and selection via the lasso. Journal of the Royal Statistical Society. Series B (Methodological), 1996, 58(1):267-288 http://cn.bing.com/academic/profile?id=2135046866&encoded=0&v=paper_preview&mkt=zh-cn [14] Hoerl A E, Kennard R W. Ridge regression:biased estimation for nonorthogonal problems. Technometrics, 1970, 12(1):55-67 doi: 10.1080/00401706.1970.10488634 [15] Fan J Q, Li R Z. Variable selection via nonconcave penalized likelihood and its oracle properties. Journal of the American statistical Association, 2001, 96(456):1348-1360 doi: 10.1198/016214501753382273 [16] Lee S R, Heo G S, Lee C Y. Representation and symbolization of motion captured human action by locality preserving projections. Applied Mathematics & Information Sciences, 2014, 8(1):441-446 http://cn.bing.com/academic/profile?id=2324349122&encoded=0&v=paper_preview&mkt=zh-cn [17] Roweis S T, Saul L K. Nonlinear dimensionality reduction by locally linear embedding. Science, 2000, 290(5500):2323-2326 doi: 10.1126/science.290.5500.2323 [18] Tang Y Y, Yuan H L, Li L Q. Manifold-based sparse representation for hyperspectral image classification. IEEE Transactions on Geoscience and Remote Sensing, 2014, 52(12):7606-7618 doi: 10.1109/TGRS.2014.2315209 [19] Boyd S, Parikh N, Chu E, Peleato B, Eckstein J. Distributed optimization and statistical learning via the alternating direction method of multipliers. Foundations and Trends in Machine Learning, 2011, 3(1):1-122 http://cn.bing.com/academic/profile?id=2164278908&encoded=0&v=paper_preview&mkt=zh-cn [20] Shi J B, Malik J. Normalized cuts and image segmentation. IEEE Transactions on Pattern Analysis and Machine Intelligence, 2000, 22(8):888-905 doi: 10.1109/34.868688 [21] Cai D, He X F, Wu X Y, Han J W. Non-negative matrix factorization on manifold. In:Proceedings of the 8th IEEE International Conference on Data Mining (ICDM). Pisa:IEEE, 2008.63-72 [22] Hou C P, Nie F P, Yi D Y, Tao D C. Discriminative embedded clustering:a framework for grouping high-dimensional data. IEEE Transactions on Neural Networks and Learning Systems, 2015, 26(6):1287-1299 doi: 10.1109/TNNLS.2014.2337335 -


 下载:
下载:
