

Gas Recognition and Concentration Estimation Model for Bionic Olfactory Perception System
-
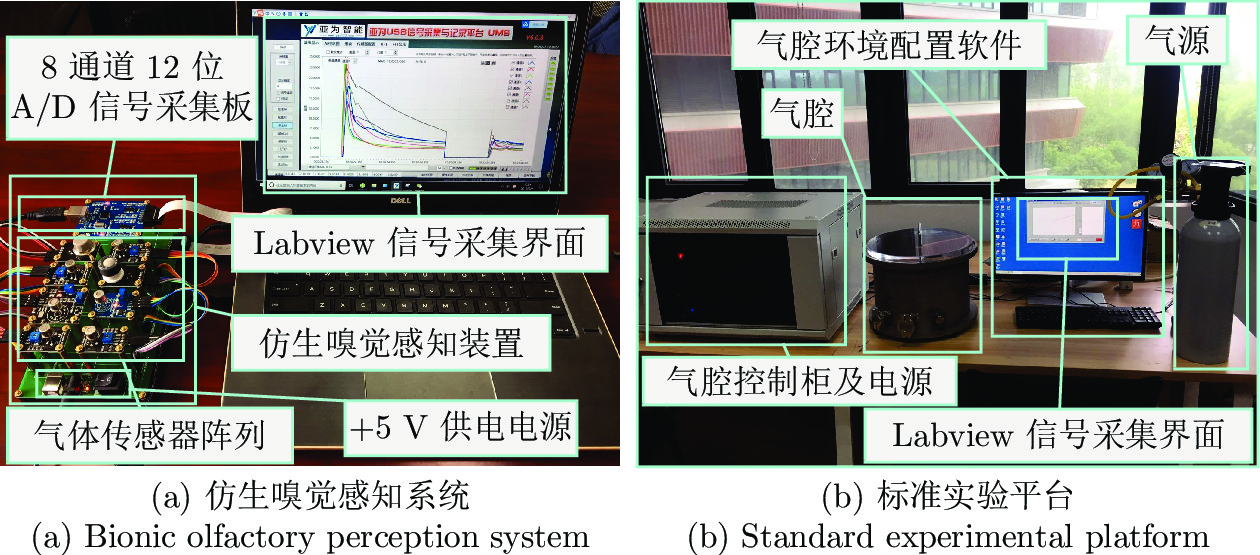
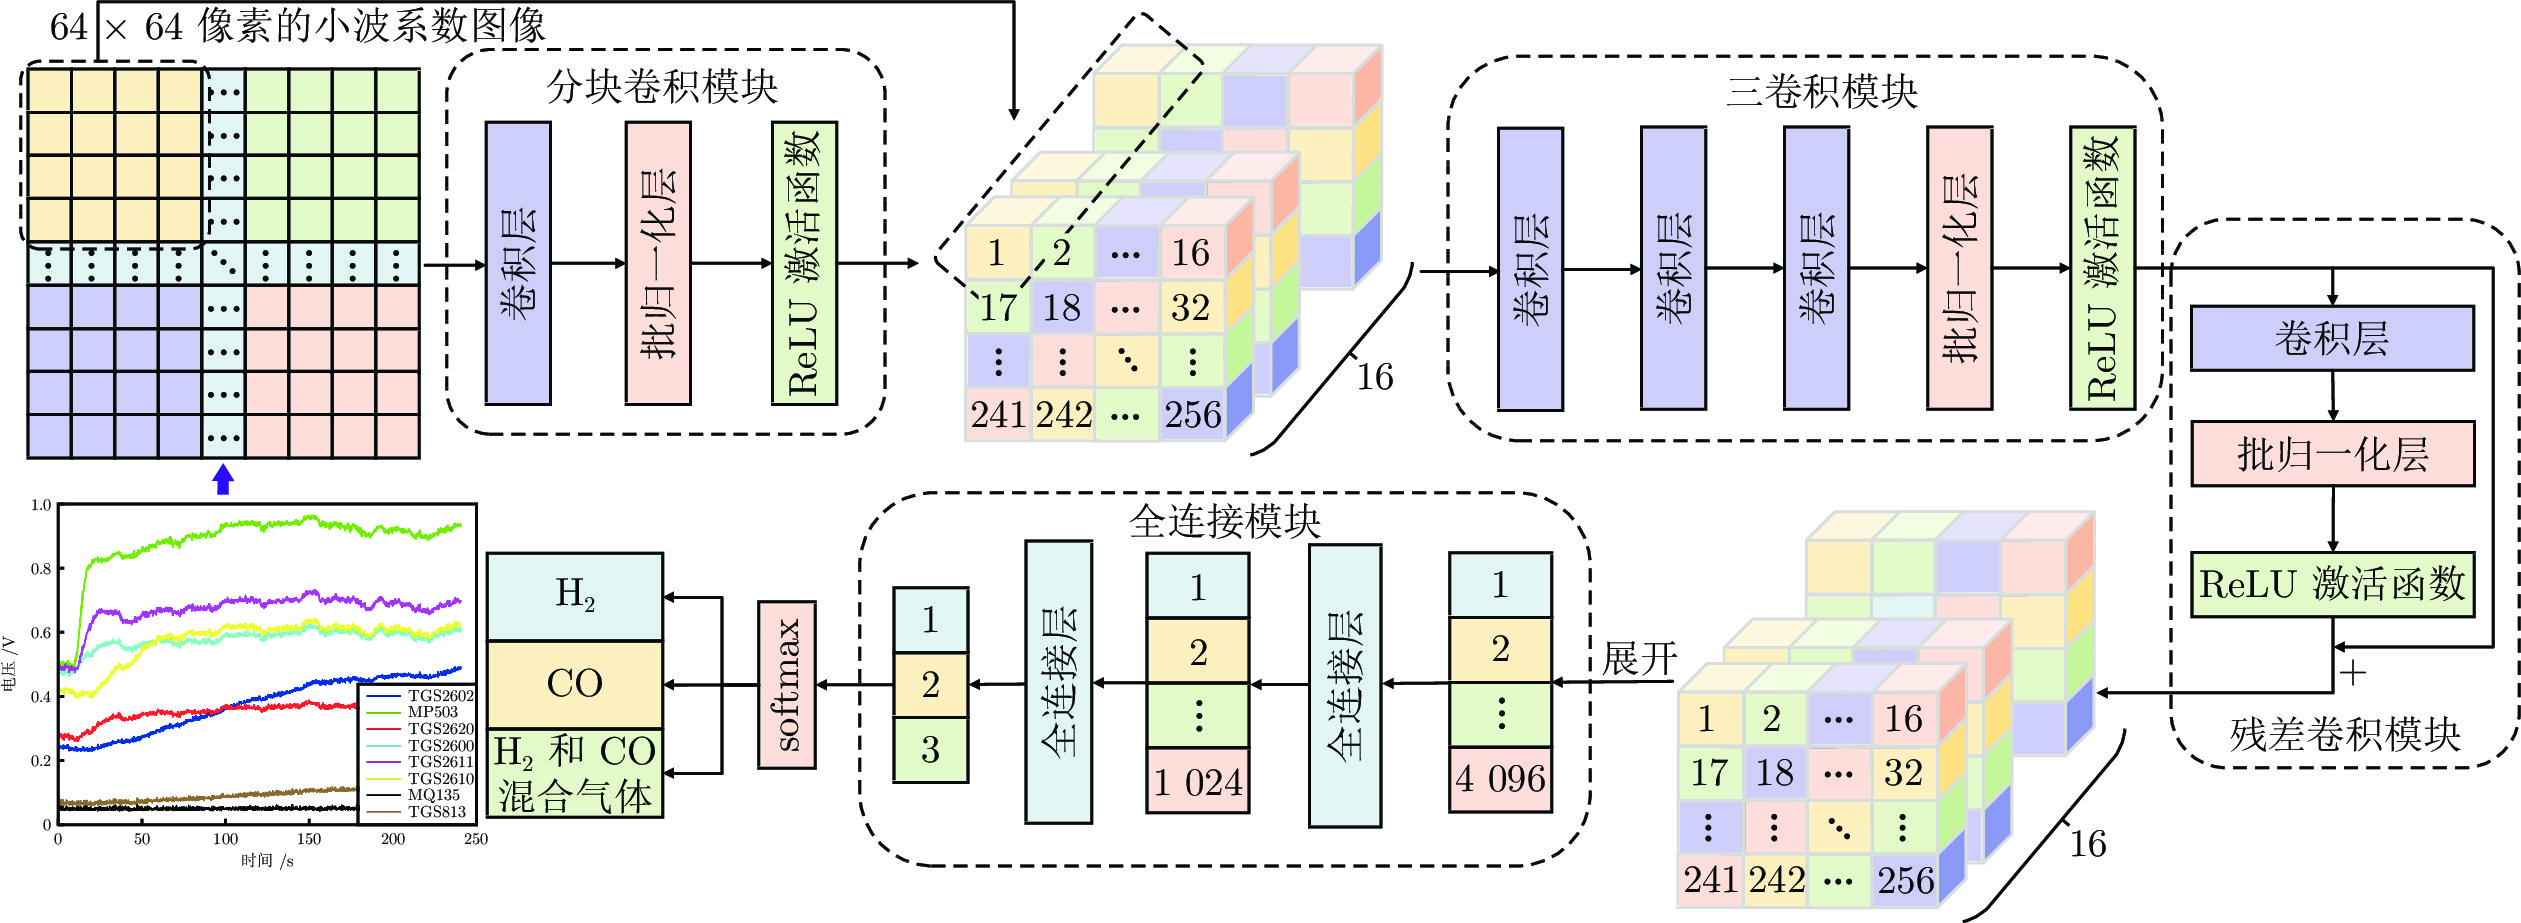
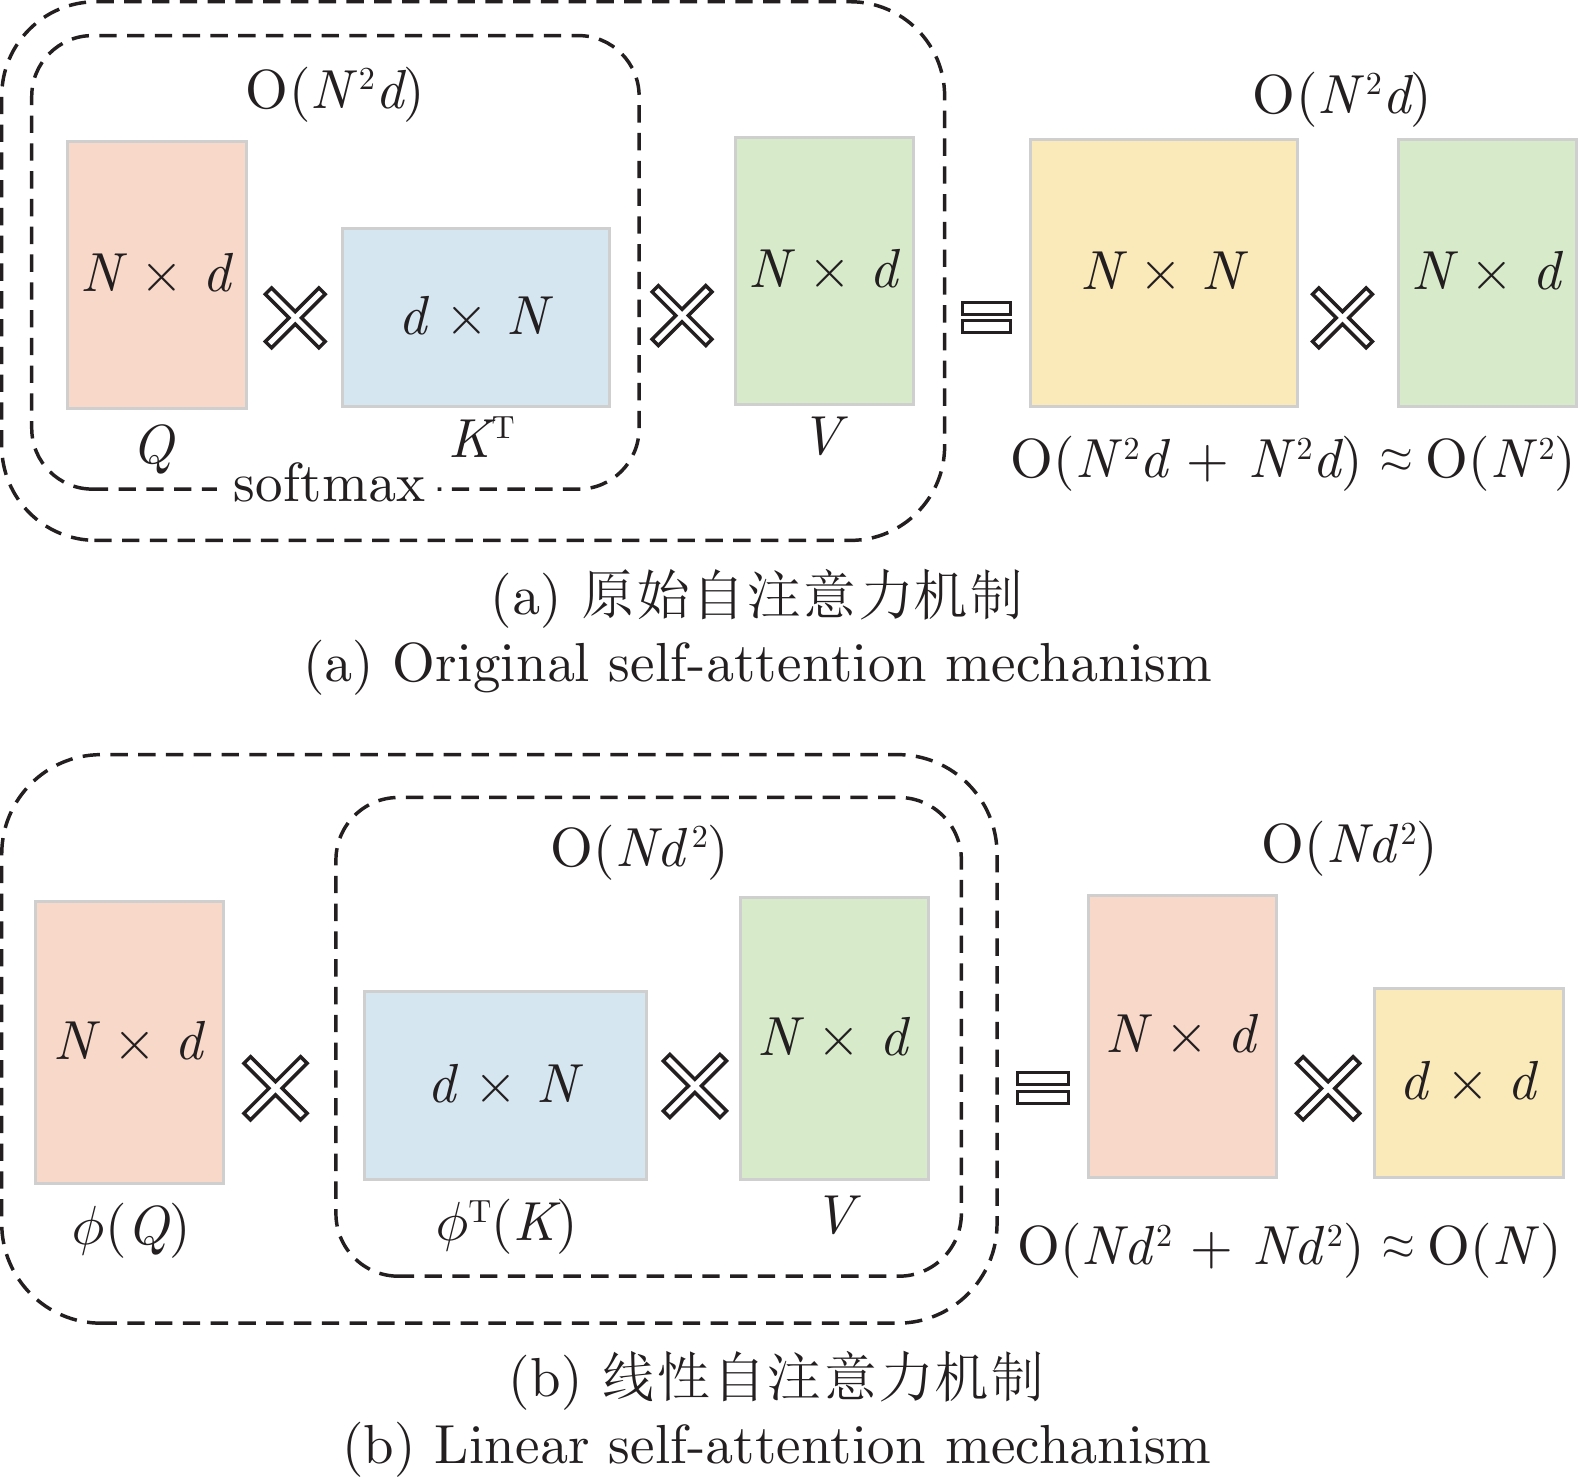
摘要: 常用气体检测模型需要使用气体传感器阵列响应信号的稳态值对气体进行种类识别和浓度估计, 而在实际环境 中, 气体一般处于动态变化的状态, 气体传感器阵列响应信号难以达到稳态值或长时间维持稳定状态. 针对上述问题, 提出 一种由动态小波残差卷积神经网络(Dynamic wavelet residual convolutional neural network, DWRCNN)子模型和权重 信号自注意力(Weighted signal self-attention, WSSA)子模型组成的气体检测模型. 该模型可以直接使用气体传感器阵列 的原始动态响应信号对动态变化的气体进行成分识别, 并进一步对每种成分气体的浓度在线估计. 通过搭建的仿生嗅觉感 知系统对模型的性能进行评估, 实验结果表明, 与常用气体识别模型相比, DWRCNN能获得接近 100%气体识别准确率, 且在线训练时间短, 收敛速度快; 与常用气体浓度估计模型相比, WSSA浓度估计模型能够大幅提高气体浓度估计精度, 并 能同时对不同气体都保持较高气体浓度估计精度, 解决了动态环境中仿生嗅觉感知系统需要针对不同气体选择不同最优气 体浓度估计模型问题.Abstract: Conventional gas detection models require the use of steady-state values of the response signals of gas sensor arrays for gas recognition and gas concentration estimation, whereas in real environments, gases are typically in a state of dynamic change, making it difficult or time-consuming to achieve steady-state values for the response signals from gas sensor arrays. To address the aforementioned issues, a gas detection model consisting of dynamic wavelet residual convolutional neural networks (DWRCNN) sub-model and weighted signal self-attention (WSSA) sub-model is proposed. The model can directly identify the components of dynamically changing gases using the raw dynamic response signals from the gas sensor array, and it can also online estimate the concentration of each component gas. The performance of the model is evaluated by the self-built bionic olfactory perception system. The results demonstrate that DWRCNN achieves nearly 100% gas recognition accuracy in comparison to other prevalent gas recognition models, with a short online training time and a rapid convergence speed; The problem of selecting different optimal gas concentration estimation models for different gases in a dynamic environment for bionic olfactory perception systems is solved by the WSSA concentration estimation model, which can significantly improve the gas concentration estimation accuracy while simultaneously maintaining a very high gas concentration estimation accuracy for different gases.
-
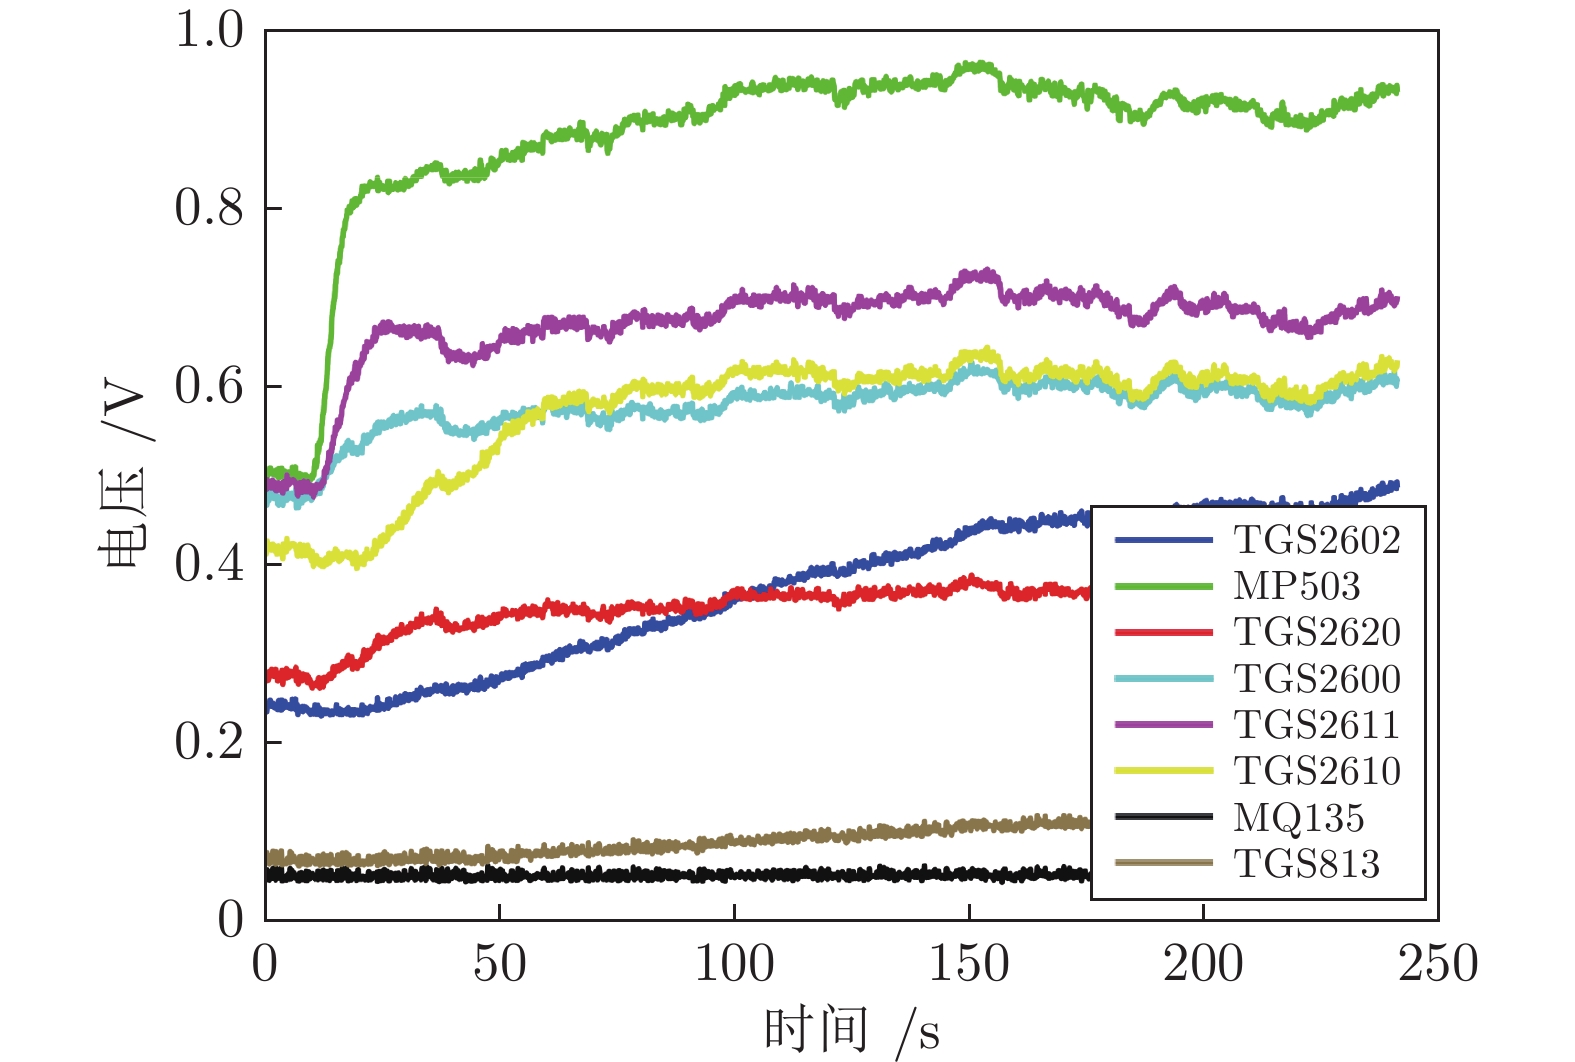
图 3 当CO浓度为140 ppm时, CO传感器阵列的动态响应信号曲线
Fig. 3 Dynamic response signal curve of the sensor array for 140 ppm CO
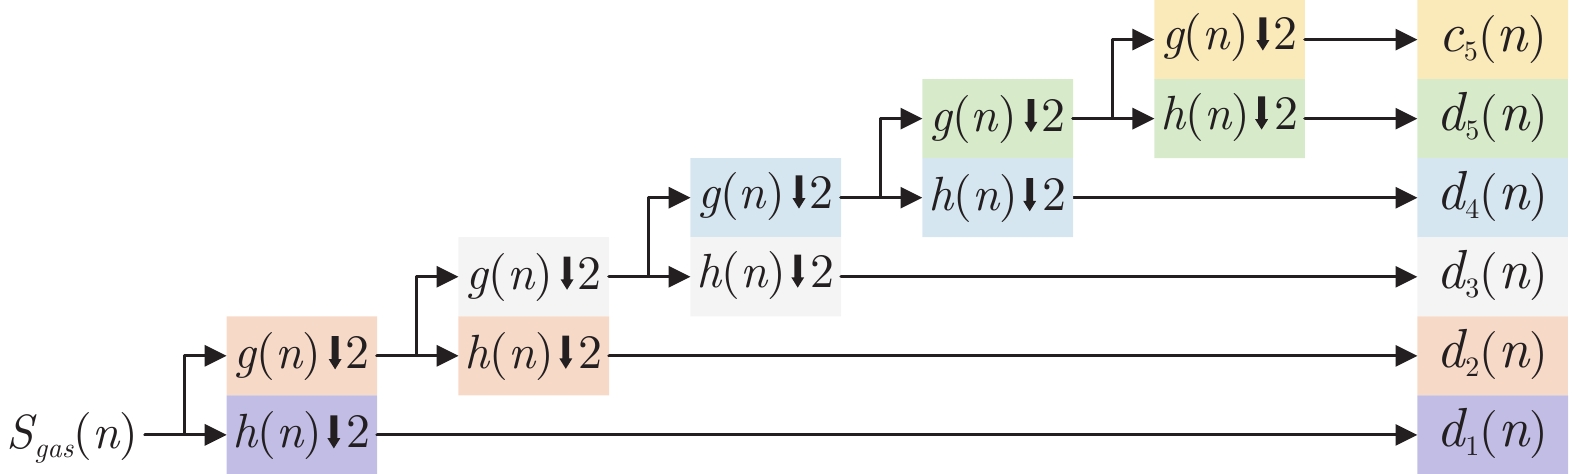
图 4 传感器阵列动态响应信号小波分解过程
Fig. 4 Wavelet decomposition process of dynamic response signal of sensor array
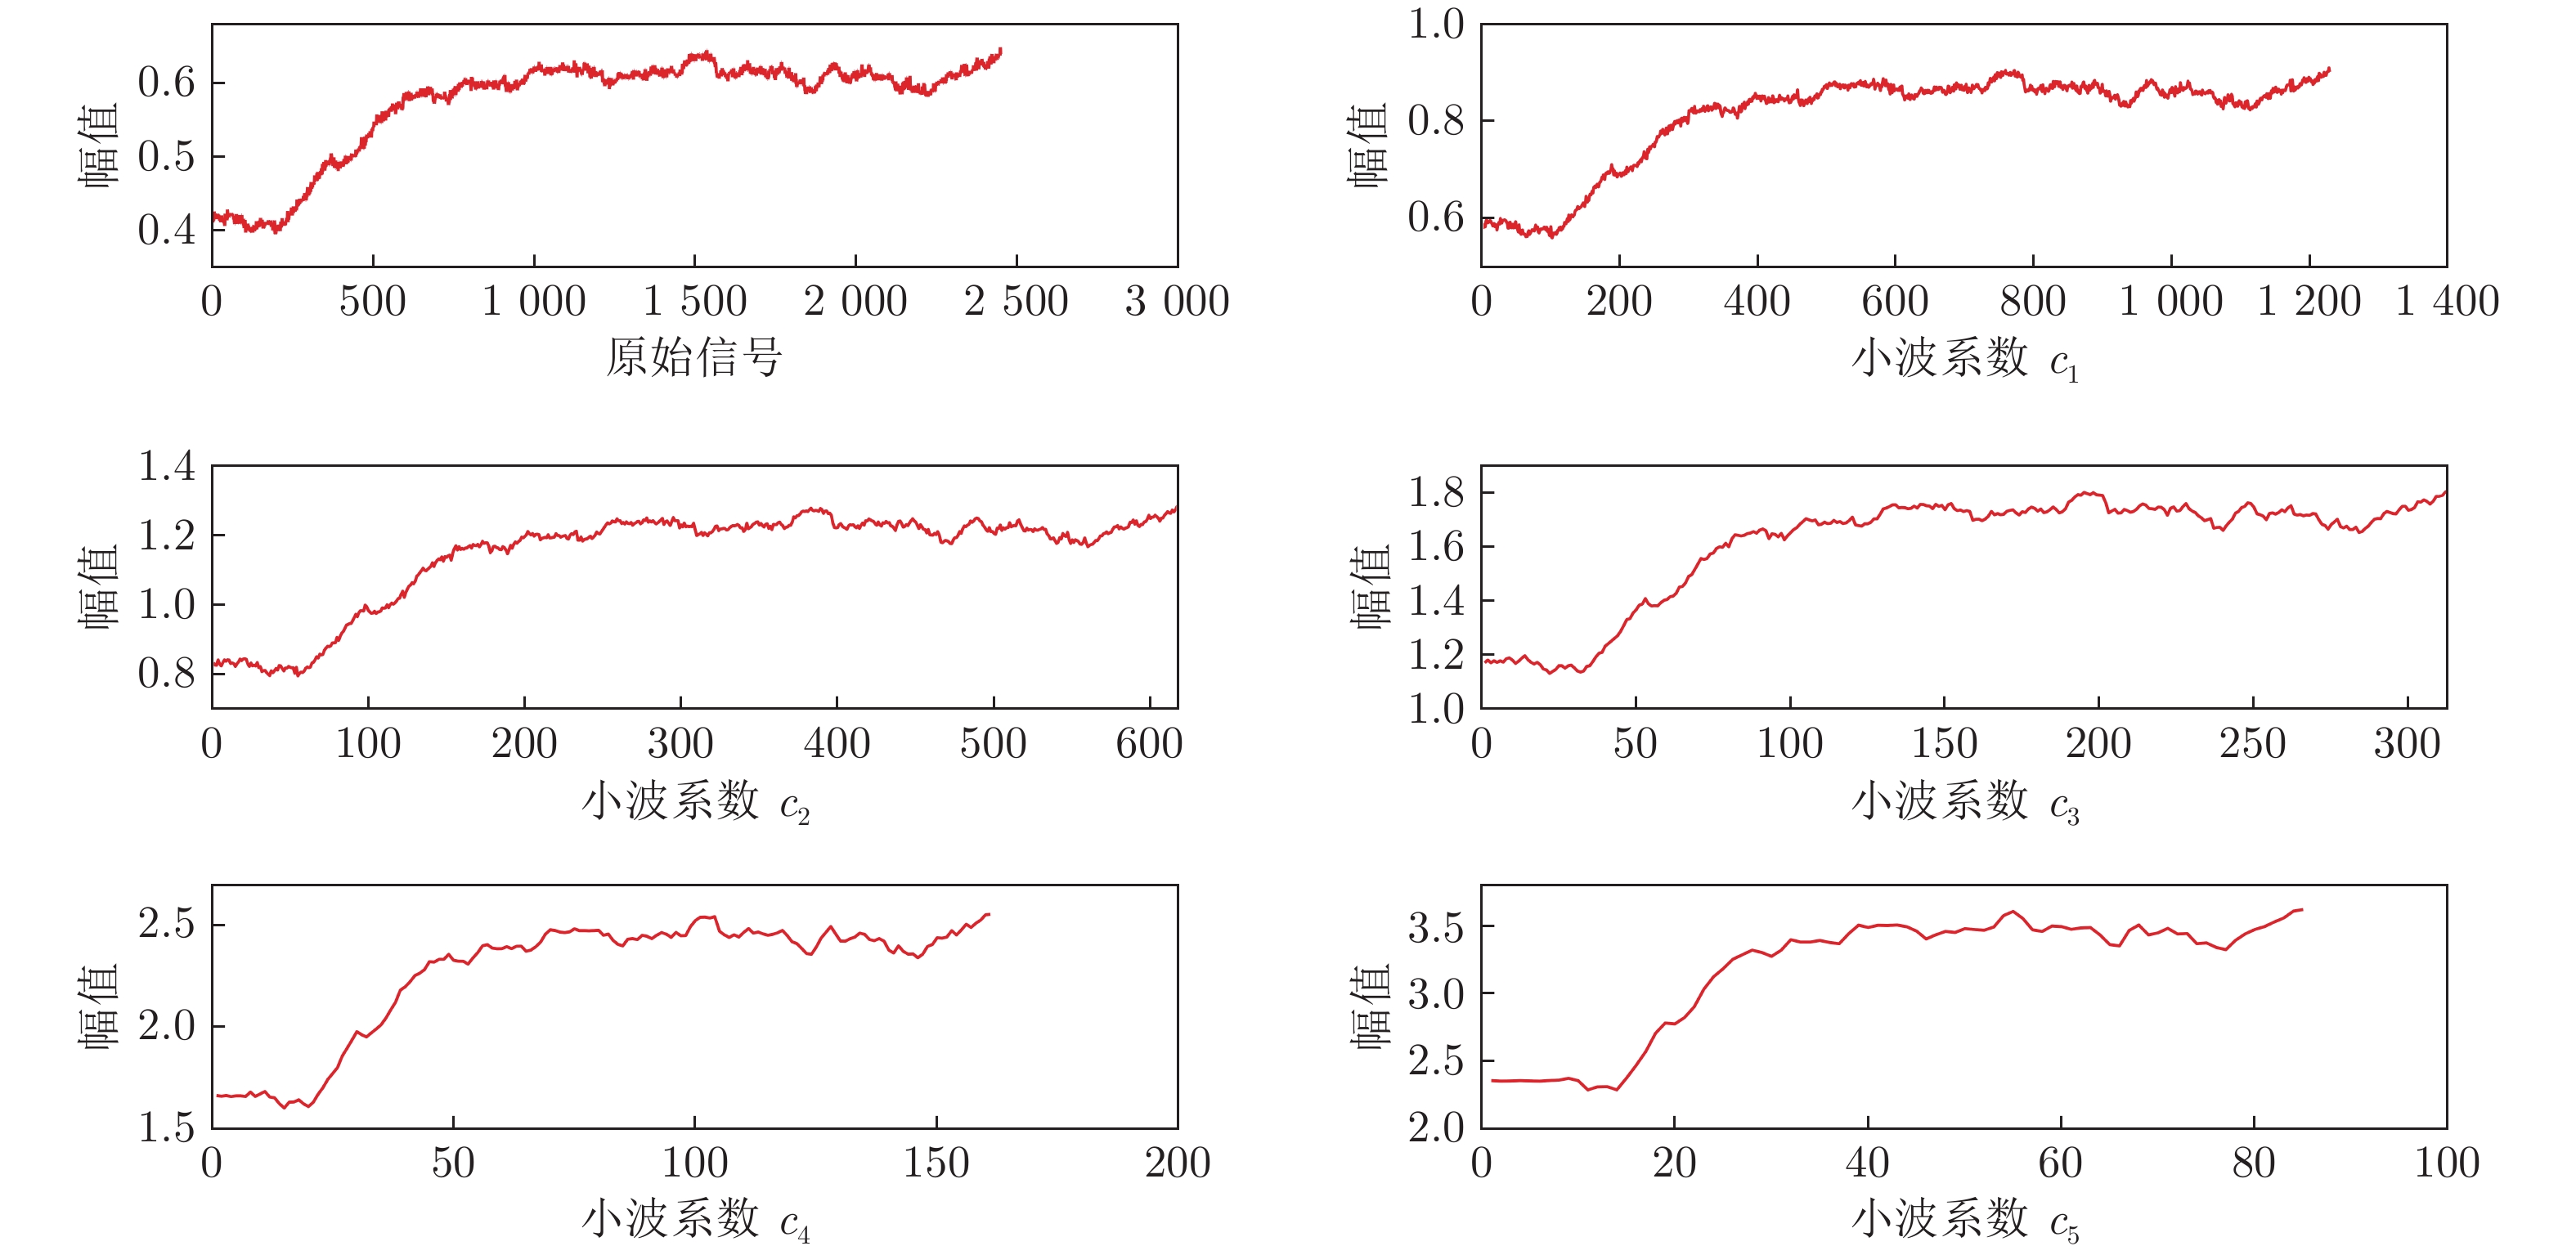
图 5 TGS2610在140 ppm CO下的动态响应信号曲线和相应的5层低频小波系数曲线
Fig. 5 Dynamic response signal curve and corresponding 5-layer low-frequency wavelet coefficient curve at 140 ppm CO for TGS2610

图 6 传感器阵列动态响应信号转换为小波系数图像过程
Fig. 6 Process of converting the dynamic response signal of the sensor array into a wavelet coefficient map
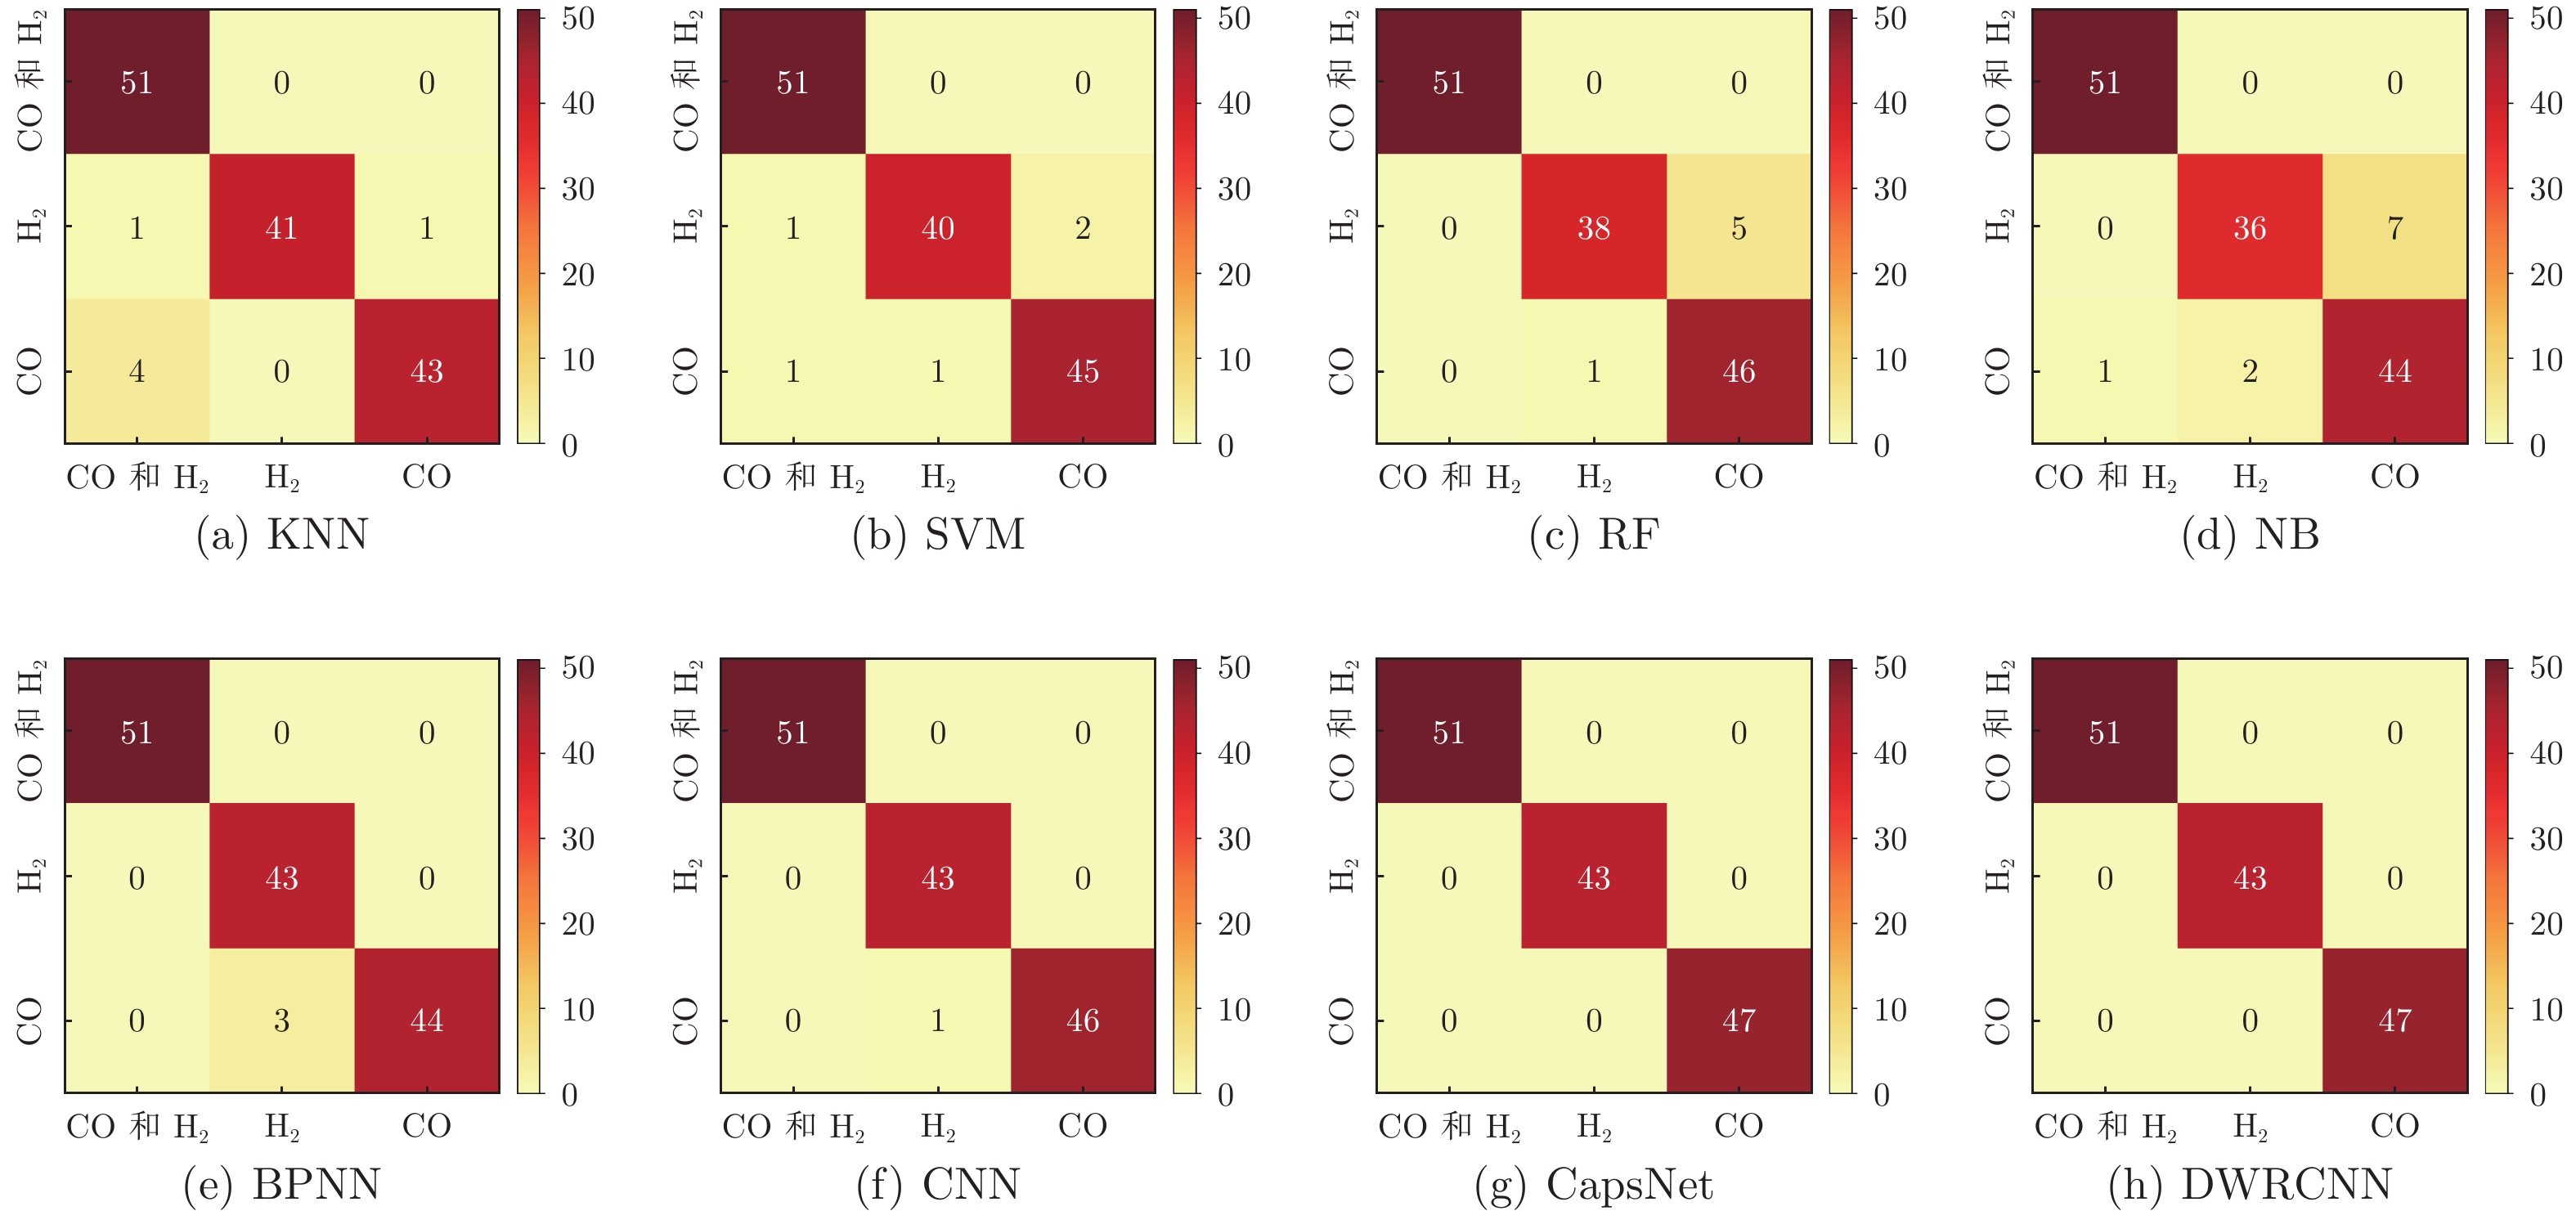
图 10 不同模型的气体识别结果混淆矩阵
Fig. 10 Confusion matrix of gas recognition results with different models
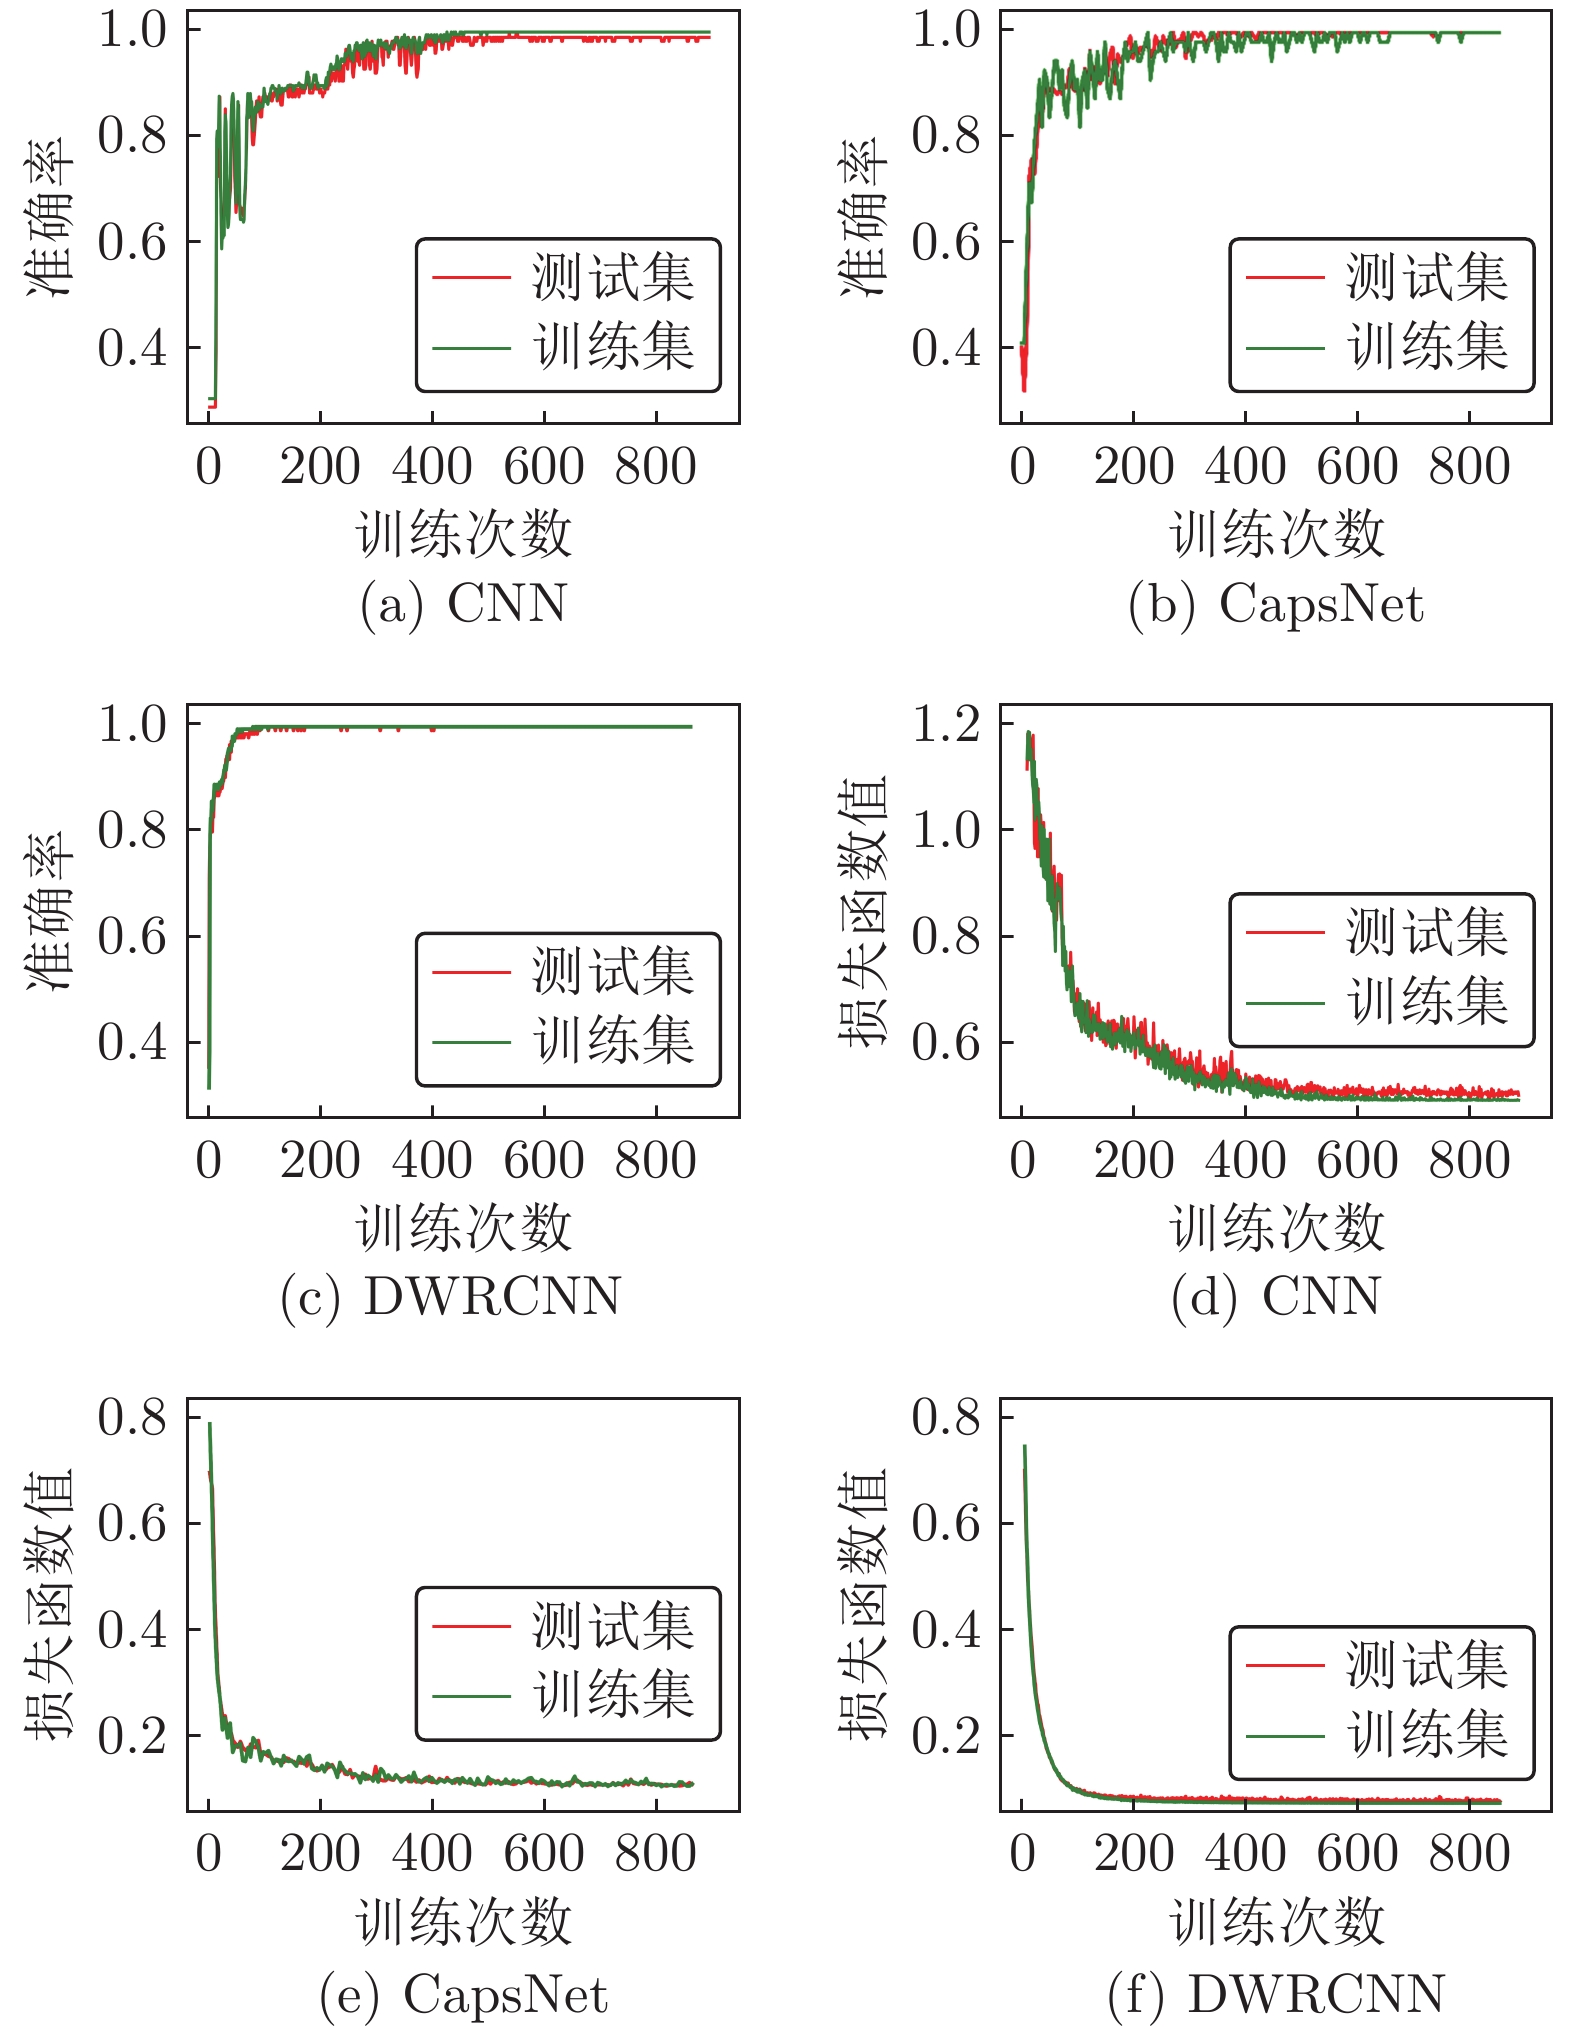
图 11 不同模型气体识别的准确率曲线和损失函数曲线
Fig. 11 Accuracy curve and loss function curve of gas recognition with different models
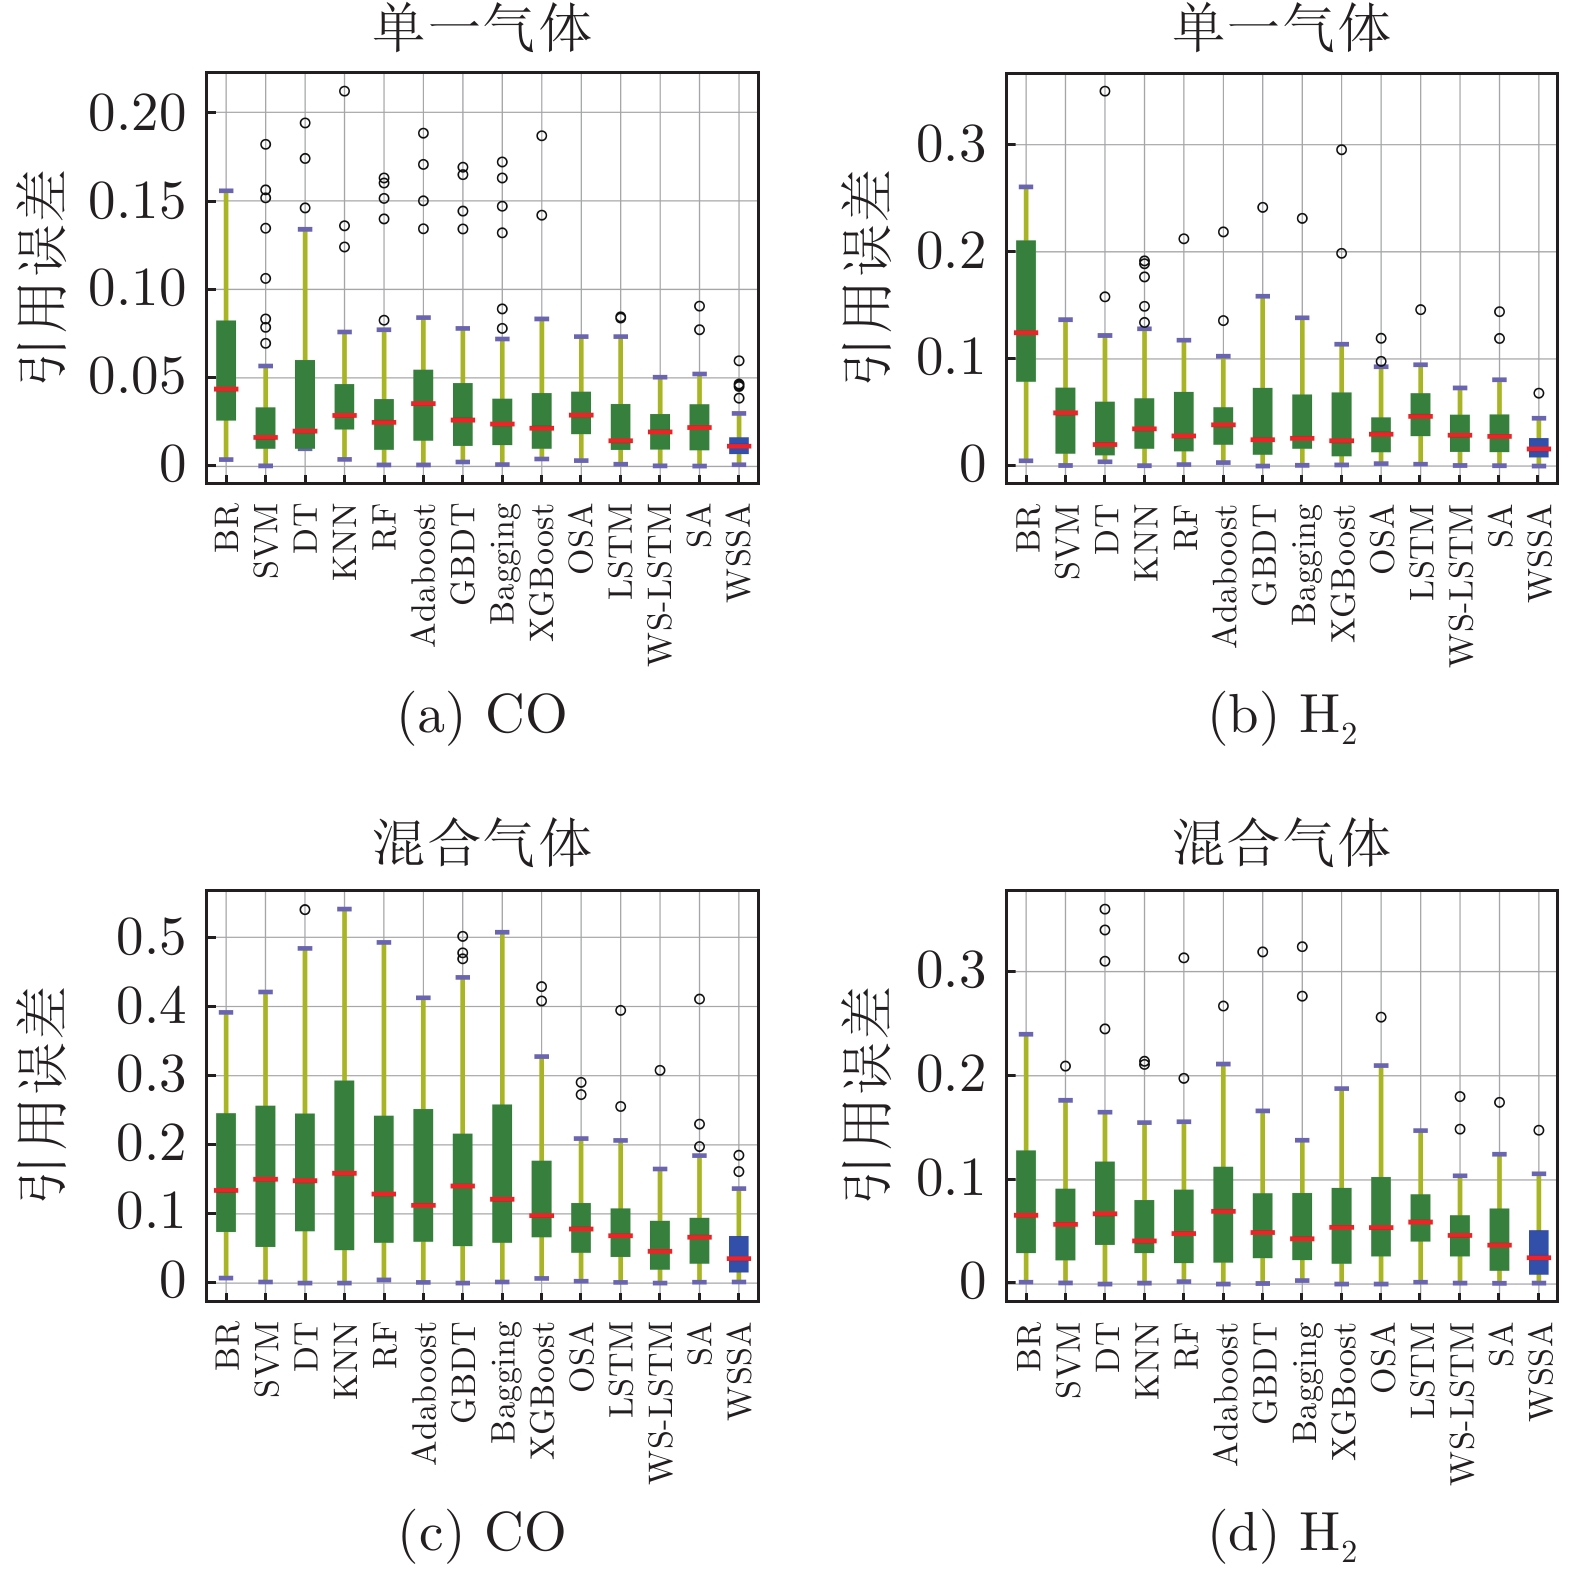
图 13 不同模型的气体浓度估计误差箱式图
Fig. 13 Error box plots of gas concentration estimation with different models
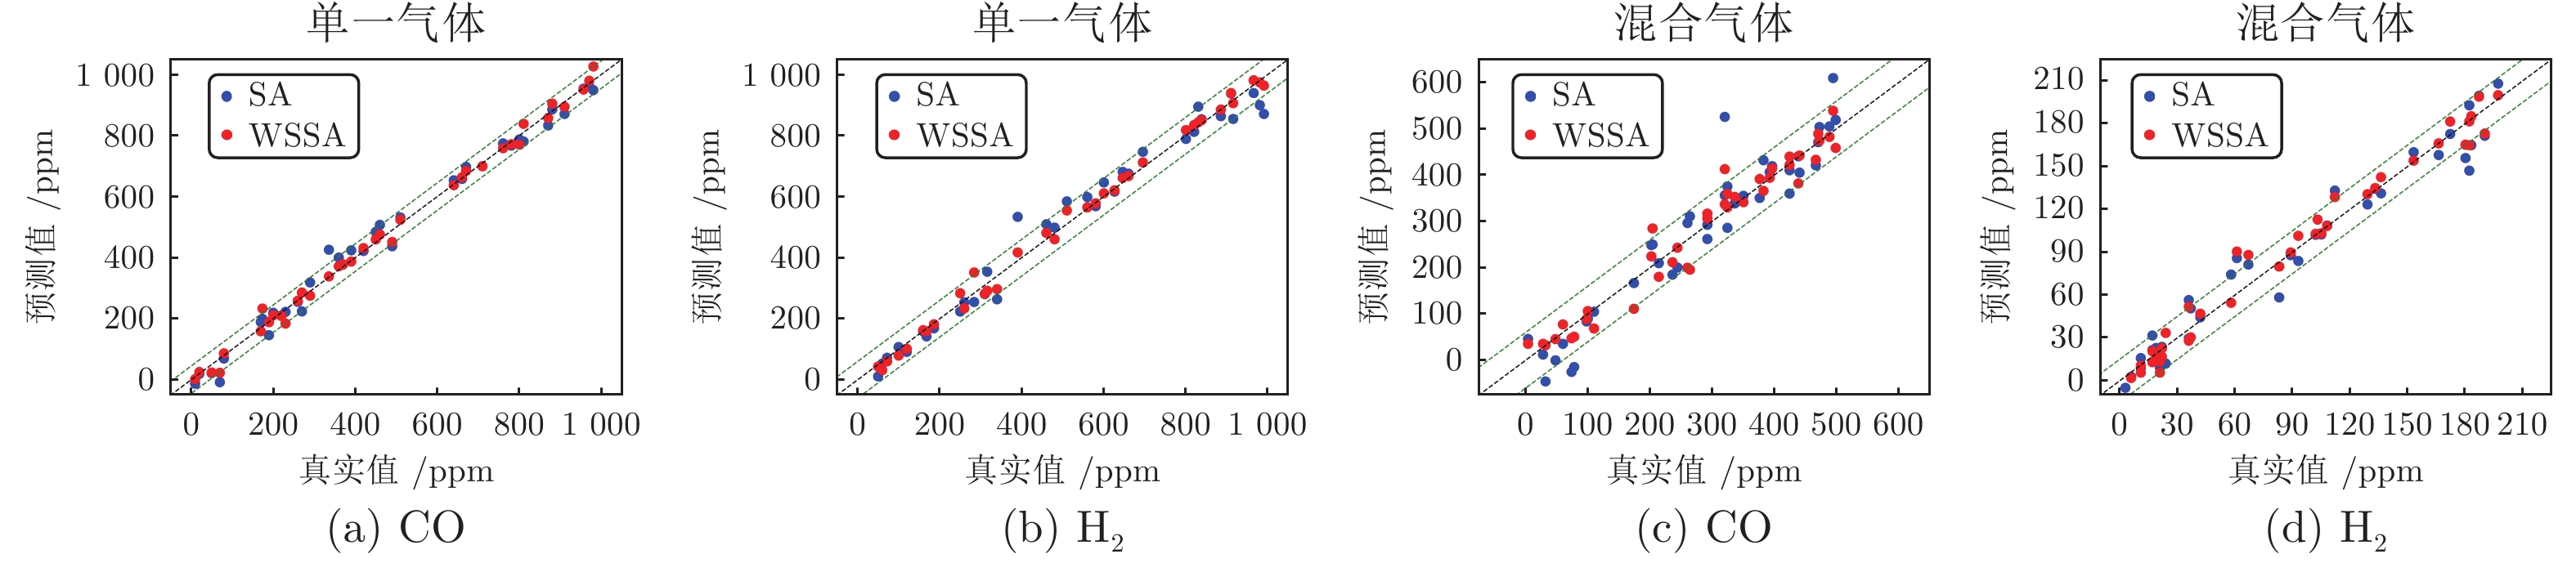
图 14 SA模型和WSSA模型的气体浓度估计散点图
Fig. 14 Scatter plots of gas concentration estimation for SA model and WSSA model
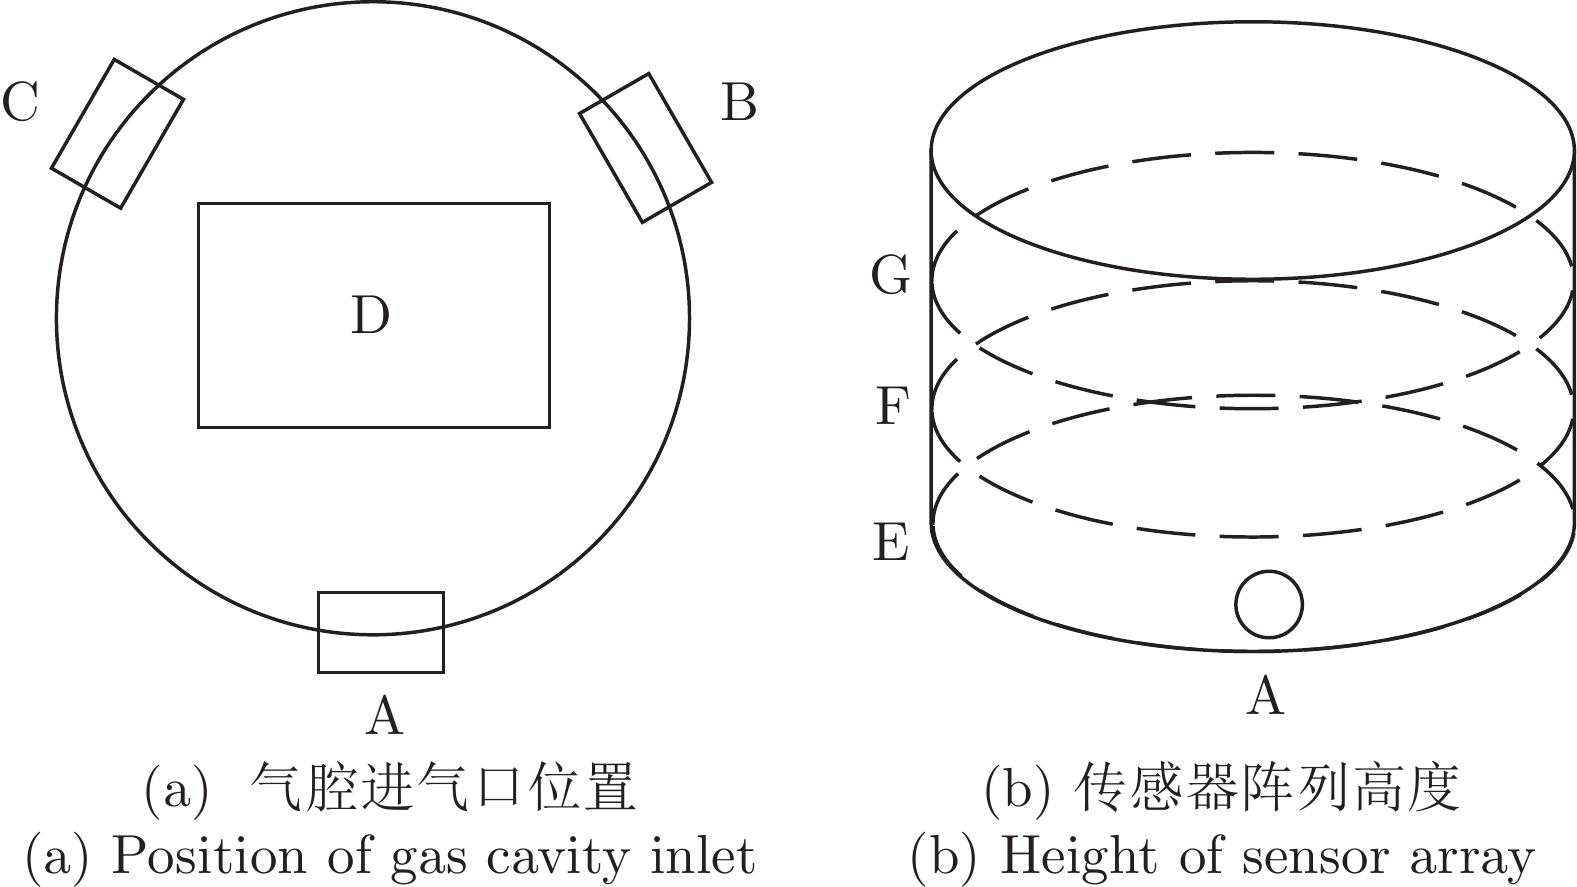
图 15 气腔进气口位置和传感器阵列高度示意图
Fig. 15 Diagram of gas cavity inlet position and sensor array height
表 1 气体传感器阵列详细信息
Table 1 Gas sensor array details
通道编号 传感器型号 公司名称 敏感的主要气体种类 通道0 MQ135 Winsen NH3、H2S、C6H6 通道1 TGS813 FIGARO CH4、CH3CH2CH3 通道2 TGS2611 FIGARO CH4 通道3 TGS2610 FIGARO CH3CH2CH3、C4H10 通道4 TGS2620 FIGARO C2H6O、有机溶剂 通道5 TGS2600 FIGARO H2、C2H6O 通道6 TGS2602 FIGARO VOC、NH3、H2S、CH2O 通道7 MP503 Winsen C2H6O、C4H10、CH2O  下载: 导出CSV
表 2 不同模型的气体识别准确率 (%)
Table 2 Gas recognition accuracy of different models (%)
方法 KNN SVM RF NB 准确率 95.74 96.45 95.74 92.91 方法 BPNN CNN CapsNet DWRCNN 准确率 97.87 99.29 100.00 100.00
下载: 导出CSV
表 3 CO浓度估计指标
Table 3 Metrics of CO concentration estimation
方法 MAE RMSE EV ${\rm{R}}^2$ BR 6.552 8.094 0.943 0.942 SVM 4.258 7.015 0.963 0.957 DT 5.472 8.039 0.949 0.943 KNN 5.033 7.075 0.958 0.956 RF 4.713 7.074 0.959 0.956 Adaboost 5.477 7.643 0.950 0.949 GBDT 4.817 7.019 0.960 0.957 Bagging 4.760 7.061 0.959 0.956 XGBoost 4.672 7.035 0.961 0.960 OSA 3.630 4.229 0.987 0.986 LSTM 2.934 3.845 0.988 0.988 WS-LSTM 2.350 3.035 0.993 0.993 SA 2.916 3.756 0.989 0.989 WSSA 2.090 2.646 0.995 0.994
下载: 导出CSV
表 4 H2浓度估计指标
Table 4 Metrics of H2 concentration estimation
方法 MAE RMSE EV ${\rm{R}}^2$ BR 16.097 18.284 0.683 0.638 SVM 5.034 6.976 0.955 0.947 DT 5.206 8.987 0.921 0.913 KNN 6.312 8.865 0.931 0.915 RF 5.073 7.157 0.951 0.945 Adaboost 5.441 7.209 0.952 0.944 GBDT 5.687 8.444 0.931 0.923 Bagging 5.346 7.667 0.940 0.936 XGBoost 5.512 8.724 0.937 0.935 OSA 4.155 5.343 0.977 0.977 LSTM 4.264 5.305 0.974 0.973 WS-LSTM 3.781 4.457 0.985 0.984 SA 4.156 5.560 0.975 0.975 WSSA 2.360 3.028 0.993 0.992
下载: 导出CSV
表 5 混合气体中CO浓度估计指标
Table 5 Metrics of CO concentration estimation in the gas mixture
方法 MAE RMSE EV R2 BR 20.134 24.487 0.530 0.526 SVM 20.009 24.657 0.519 0.519 DT 20.537 25.746 0.515 0.476 KNN 21.236 26.701 0.443 0.436 RF 18.529 23.614 0.581 0.559 Adaboost 19.950 25.019 0.526 0.505 GBDT 20.830 26.193 0.481 0.457 Bagging 19.608 25.288 0.531 0.494 XGBoost 15.931 20.101 0.619 0.592 OSA 10.909 13.589 0.860 0.859 LSTM 10.439 14.050 0.856 0.849 WS-LSTM 7.958 11.188 0.911 0.904 SA 9.209 12.958 0.872 0.872 WSSA 6.014 7.616 0.956 0.956
下载: 导出CSV
表 6 混合气体中H2浓度估计指标
Table 6 Metrics of H2 concentration estimation in the gas mixture
方法 MAE RMSE EV R2 BR 9.956 12.378 0.897 0.897 SVM 8.008 10.106 0.931 0.931 DT 11.326 15.503 0.842 0.838 KNN 7.297 9.641 0.937 0.937 RF 7.852 10.823 0.922 0.921 Adaboost 9.120 11.582 0.915 0.909 GBDT 7.763 10.622 0.924 0.924 Bagging 8.019 11.394 0.915 0.912 XGBoost 7.840 10.089 0.932 0.931 OSA 8.886 11.720 0.912 0.910 LSTM 7.783 8.848 0.949 0.949 WS-LSTM 5.095 6.878 0.969 0.969 SA 5.906 7.776 0.960 0.960 WSSA 4.318 6.362 0.974 0.973
下载: 导出CSV
表 7 气体识别准确率 (%)
Table 7 Gas recognition accuracy (%)
气腔进气口位置 A B C 准确率 100 100 100 传感器阵列摆放高度 E F G 准确率 100 100 100
下载: 导出CSV
表 8 气腔进气口位置不同时单一气体浓度估计的指标
Table 8 Metrics for concentration estimation of single gas with different gas cavity inlet positions
进气口位置 气体种类 MAE RMSE EV R2 A CO 2.090 2.646 0.995 0.994 H2 2.360 3.028 0.993 0.992 B CO 2.326 3.017 0.994 0.994 H2 2.287 2.898 0.994 0.994 C CO 2.185 2.812 0.995 0.994 H2 2.419 3.177 0.992 0.992
下载: 导出CSV
表 9 气腔进气口位置不同时混合气体浓度估计的指标
Table 9 Metrics for concentration estimation of mixed gases with different gas cavity inlet positions
进气口位置 气体种类 MAE RMSE EV R2 A CO 6.014 7.616 0.956 0.956 H2 4.318 6.362 0.974 0.973 B CO 5.679 6.899 0.963 0.962 H2 4.562 6.713 0.973 0.973 C CO 5.878 7.256 0.961 0.961 H2 4.785 6.896 0.972 0.972
下载: 导出CSV
表 10 传感器阵列摆放高度不同时单一气体浓度估计指标
Table 10 Metrics for concentration estimation of single gas with different sensor array placement heights
高度 气体种类 MAE RMSE EV R2 E CO 2.090 2.646 0.995 0.994 H2 2.360 3.028 0.993 0.992 F CO 2.283 2.878 0.994 0.994 H2 2.226 2.873 0.994 0.994 G CO 2.375 3.122 0.993 0.993 H2 2.451 3.163 0.992 0.992
下载: 导出CSV
表 11 传感器阵列摆放高度不同时混合气体浓度估计指标
Table 11 Metrics for concentration estimation of mixed gases with different sensor array placement heights
高度 气体种类 MAE RMSE EV R2 E CO 6.014 7.616 0.956 0.956 H2 4.318 6.362 0.974 0.973 F CO 6.323 8.012 0.955 0.955 H2 4.619 6.992 0.972 0.972 G CO 6.225 7.896 0.956 0.955 H2 4.673 7.105 0.972 0.972
下载: 导出CSV
表 12 本文模型的气体识别准确率 (%)
Table 12 Gas recognition accuracy of our model (%)
信号采集 第1次 第2次 第3次 准确率 100.00 100.00 99.29
下载: 导出CSV
表 13 单一气体浓度估计指标
Table 13 Metrics for concentration estimation of single gas
信号采集 气体种类 MAE RMSE EV R2 第1次 CO 2.090 2.646 0.995 0.994 H2 2.360 3.028 0.993 0.992 第2次 CO 2.512 3.283 0.992 0.992 H2 2.814 3.684 0.991 0.991 第3次 CO 2.985 3.872 0.989 0.989 H2 3.350 4.115 0.988 0.987
下载: 导出CSV
表 14 混合气体浓度估计指标
Table 14 Metrics for concentration estimation of mixed gases
信号采集 气体种类 MAE RMSE EV R2 第1次 CO 6.014 7.616 0.956 0.956 H2 4.318 6.362 0.974 0.973 第2次 CO 6.711 8.813 0.941 0.940 H2 5.157 6.972 0.967 0.967 第3次 CO 7.016 9.437 0.934 0.934 H2 5.815 7.654 0.962 0.962
下载: 导出CSV
-
[1] Jing Y Q, Meng Q H, Qi P F, Cao M L, Zeng M, Ma S G. A bioinspired neural network for data processing in an electronic nose. IEEE Transactions on Instrumentation and Measurement, 2016, 65(10): 2369−2380 doi: 10.1109/TIM.2016.2578618 [2] Persaud K, Dodd G. Analysis of discrimination mechanisms in the mammalian olfactory system using a model nose. Nature, 1982, 299(5881): 352−355 doi: 10.1038/299352a0 [3] Jiang X, Jia P F, Luo R D, Deng B, Duan S K, Jia Y. A novel electronic nose learning technique based on active learning: EQBC-RBFNN. Sensors and Actuators B: Chemical, 2017, 249: 533−541 doi: 10.1016/j.snb.2017.04.072 [4] Zhang L, Zhang D. Efficient solutions for discreteness, drift, and disturbance (3D) in electronic olfaction. IEEE Transactions on Systems, Man, and Cybernetics: Systems, 2018, 48(2): 242−254 doi: 10.1109/TSMC.2016.2597800 [5] Zhang L, Tian F C, Kadri C, Guang S P, Li H J, Pan L. Gases concentration estimation using heuristics and bio-inspired optimization models for experimental chemical electronic nose. Sensors and Actuators B: Chemical, 2011, 160(1): 760−770 doi: 10.1016/j.snb.2011.08.060 [6] Buma A I, Muller M, de Vries R, Sterk P J, van der Noort V, Wolf-Lansdorf M, et al. eNose analysis for early immunotherapy response monitoring in non-small cell lung cancer. Lung Cancer, 2021, 160: 36−43 doi: 10.1016/j.lungcan.2021.07.017 [7] Lee J M, Choi E J, Chung J H, Lee K W, Lee Y, Kim Y J, et al. A DNA-derived phage nose using machine learning and artificial neural processing for diagnosing lung cancer. Biosensors and Bioelectronics, 2021, 194: Article No. 113567 doi: 10.1016/j.bios.2021.113567 [8] Xu M, Wang J, Zhu L. Tea quality evaluation by applying E-nose combined with chemo-metrics methods. Journal of Food Science and Technology, 2021, 58: 1549−1561 doi: 10.1007/s13197-020-04667-0 [9] Sanaeifar A, Li X L, He Y, Huang Z X, Zhan Z H. A data fusion approach on confocal Raman micro-spectroscopy and electronic nose for quantitative evaluation of pesticide residue in tea. Biosystems Engineering, 2021, 210: 206−222 doi: 10.1016/j.biosystemseng.2021.08.016 [10] Ari D, Alagoz B B. An effective integrated genetic programming and neural network model for electronic nose calibration of air pollution monitoring application. Neural Computing and Applications, 2022, 34(15): 12633−12652 doi: 10.1007/s00521-022-07129-0 [11] 高月, 宿翀, 李宏光. 一类基于非线性PCA和深度置信网络的混合分类器及其在PM2.5浓度预测和影响因素诊断中的应用. 自动化学报, 2018, 44(2): 318−329 doi: 10.16383/j.aas.2018.c160045Gao Yue, Su Chong, Li Hong-Guang. A kind of deep belief networks based on nonlinear features extraction with application to PM2.5 concentration prediction and diagnosis. Acta Automatica Sinica, 2018, 44(2): 318−329 doi: 10.16383/j.aas.2018.c160045 [12] Patil S J, Duragkar N, Rao V R. An ultra-sensitive piezoresistive polymer nano-composite micro-cantilever sensor electronic nose platform for explosive vapor detection. Sensors and Actuators B: Chemical, 2014, 192: 444−451 doi: 10.1016/j.snb.2013.10.111 [13] Yan K, Zhang D. Improving the transfer ability of prediction models for electronic noses. Sensors and Actuators B: Chemical, 2015, 220: 115−124 doi: 10.1016/j.snb.2015.05.060 [14] Liao F, Yin S, Toney M F, Subramanian V. Physical discrimination of amine vapor mixtures using polythiophene gas sensor arrays. Sensors and Actuators B: Chemical, 2010, 150: 254−263 doi: 10.1016/j.snb.2010.07.006 [15] Hu H, Yang X X, Guo X D, Khaliji K, Biswas S R, Javier García de Abajo F, et al. Gas identification with graphene plasmons. Nature Communication, 2019, 10(1): 1−7 doi: 10.1038/s41467-018-07882-8 [16] Qian J H, Tian F C, Luo Y, Lu M C, Zhang A L. A novel multi-sensor detection system design for low concentrations of volatile organic compounds. IEEE Transactions on Industrial Electronics, 2021, 69(5): 5314−5324 [17] Hu J Z, Qu H M, Chang Y, Pang W, Zhang Q K, Liu J, et al. Miniaturized polymer coated film bulk acoustic wave resonator sensor array for quantitative gas chromatographic analysis. Sensors and Actuators B: Chemical, 2018, 274: 419−426 doi: 10.1016/j.snb.2018.07.162 [18] 孟凡利, 季瀚洋, 苑振宇, 张华, 王稼鹏. 二氧化锡传感器对挥发性有机物的动态测试方法研究. 自动化学报, 2022, 48(3): 926−934Meng Fan-Li, Ji Han-Yang, Yuan Zhen-Yu, Zhang Hua, Wang Jia-Peng. Study on dynamic testing method of volatile organic compounds by tin dioxide sensor. Acta Automatica Sinica, 2022, 48(3): 926−934 [19] Xiong Y Z, Chen Y T, Chen C M, Wei X W, Xue Y Y, Wan H, et al. An odor recognition algorithm of electronic noses based on convolutional spiking neural network for spoiled food identification. Journal of the Electrochemical Society, 2021, 168(7): Article No. 077519 doi: 10.1149/1945-7111/ac1699 [20] Wang S H, Chou T I, Tang K T. Using a hybrid deep neural network for gas classification. IEEE Sensors Journal, 2021, 21(5): 6401−6407 doi: 10.1109/JSEN.2020.3038304 [21] Zhang L, Deng P L. Abnormal odor detection in electronic nose via self-expression inspired extreme learning machine. IEEE Transactions on Systems, Man, and Cybernetics: Systems, 2017, 49(10): 1922−1932 [22] He A X, Wei G F, Yu J, Tang Z N, Lin Z H, Wang P J. A novel dictionary learning method for gas identification with a gas sensor array. IEEE Transactions on Industrial Electronics, 2017, 64(12): 9709−9715 doi: 10.1109/TIE.2017.2748034 [23] Sun H, Tian F C, Liang Z F, Sun T, Yu B, Yang S X, et al. Sensor array optimization of electronic nose for detection of bacteria in wound infection. IEEE Transactions on Industrial Electronics, 2017, 64(9): 7350−7358 doi: 10.1109/TIE.2017.2694353 [24] Liu Y J, Meng Q H, Zhang X N. Data processing for multiple electronic noses using sensor response visualization. IEEE Sensors Journal, 2018, 18(22): 9360−9369 doi: 10.1109/JSEN.2018.2871599 [25] Zhang L, Zhang D. Domain adaptation extreme learning machines for drift compensation in E-nose systems. IEEE Transactions on Instrumentation and Measurement, 2014, 64(7): 1790− 1801 [26] Liu Y J, Meng Q H, Qi P F, Sun B, Zhu X S. Using spike-based bio-inspired olfactory model for data processing in electronic noses. IEEE Sensors Journal, 2017, 18(2): 692−702 [27] He K M, Zhang X Y, Ren S Q, Sun J. Deep residual learning for image recognition. In: Proceedings of the IEEE Conference on Computer Vision and Pattern Recognition. Las Vegas, USA: IEEE, 2016. 770−778 [28] Vaswani A, Shazeer N, Parmar N, Uszkoreit J, Jones L, Gomez A N, et al. Attention is all you need. In: Proceedings of the 35th International Conference on Neural Information Processing Systems. Long Beach, USA: NIPS, 2017. 5998−6008 [29] Qin Z, Sun W X, Deng H, Li D X, Wei Y S, Lv B H, et al. cosFormer: Rethinking softmax in attention. In: Proceedings of the 10th International Conference on Learning Representations. Virtual Event: 2022. [30] Crowther P S, Cox R J. A method for optimal division of data sets for use in neural networks. In: Proceedings of the 9th International Conference on Knowledge-based and Intelligent Information and Engineering Systems. Melbourne, Australia: Springer, 2005. 1−7 [31] Zhang W W, Wang L, Chen J, Xiao W X, Bi X. A novel gas recognition and concentration detection algorithm for artificial olfaction. IEEE Transactions on Instrumentation and Measurem-ent, 2021, 70: 1−14 [32] Zhang W W, Xiang H T, Wang Y X, Bi X, Zhang Y Z, Zhang P J, et al. A signal response visualization gas recognition algorithm based on a wavelet transform coefficient map-capsule network for artificial olfaction. IEEE Sensors Journal, 2022, 22(15): 14717−14726 doi: 10.1109/JSEN.2022.3184963 -


计量
- 文章访问数: 534
- HTML全文浏览量: 187
- PDF下载量: 132
- 被引次数: 0
