

-
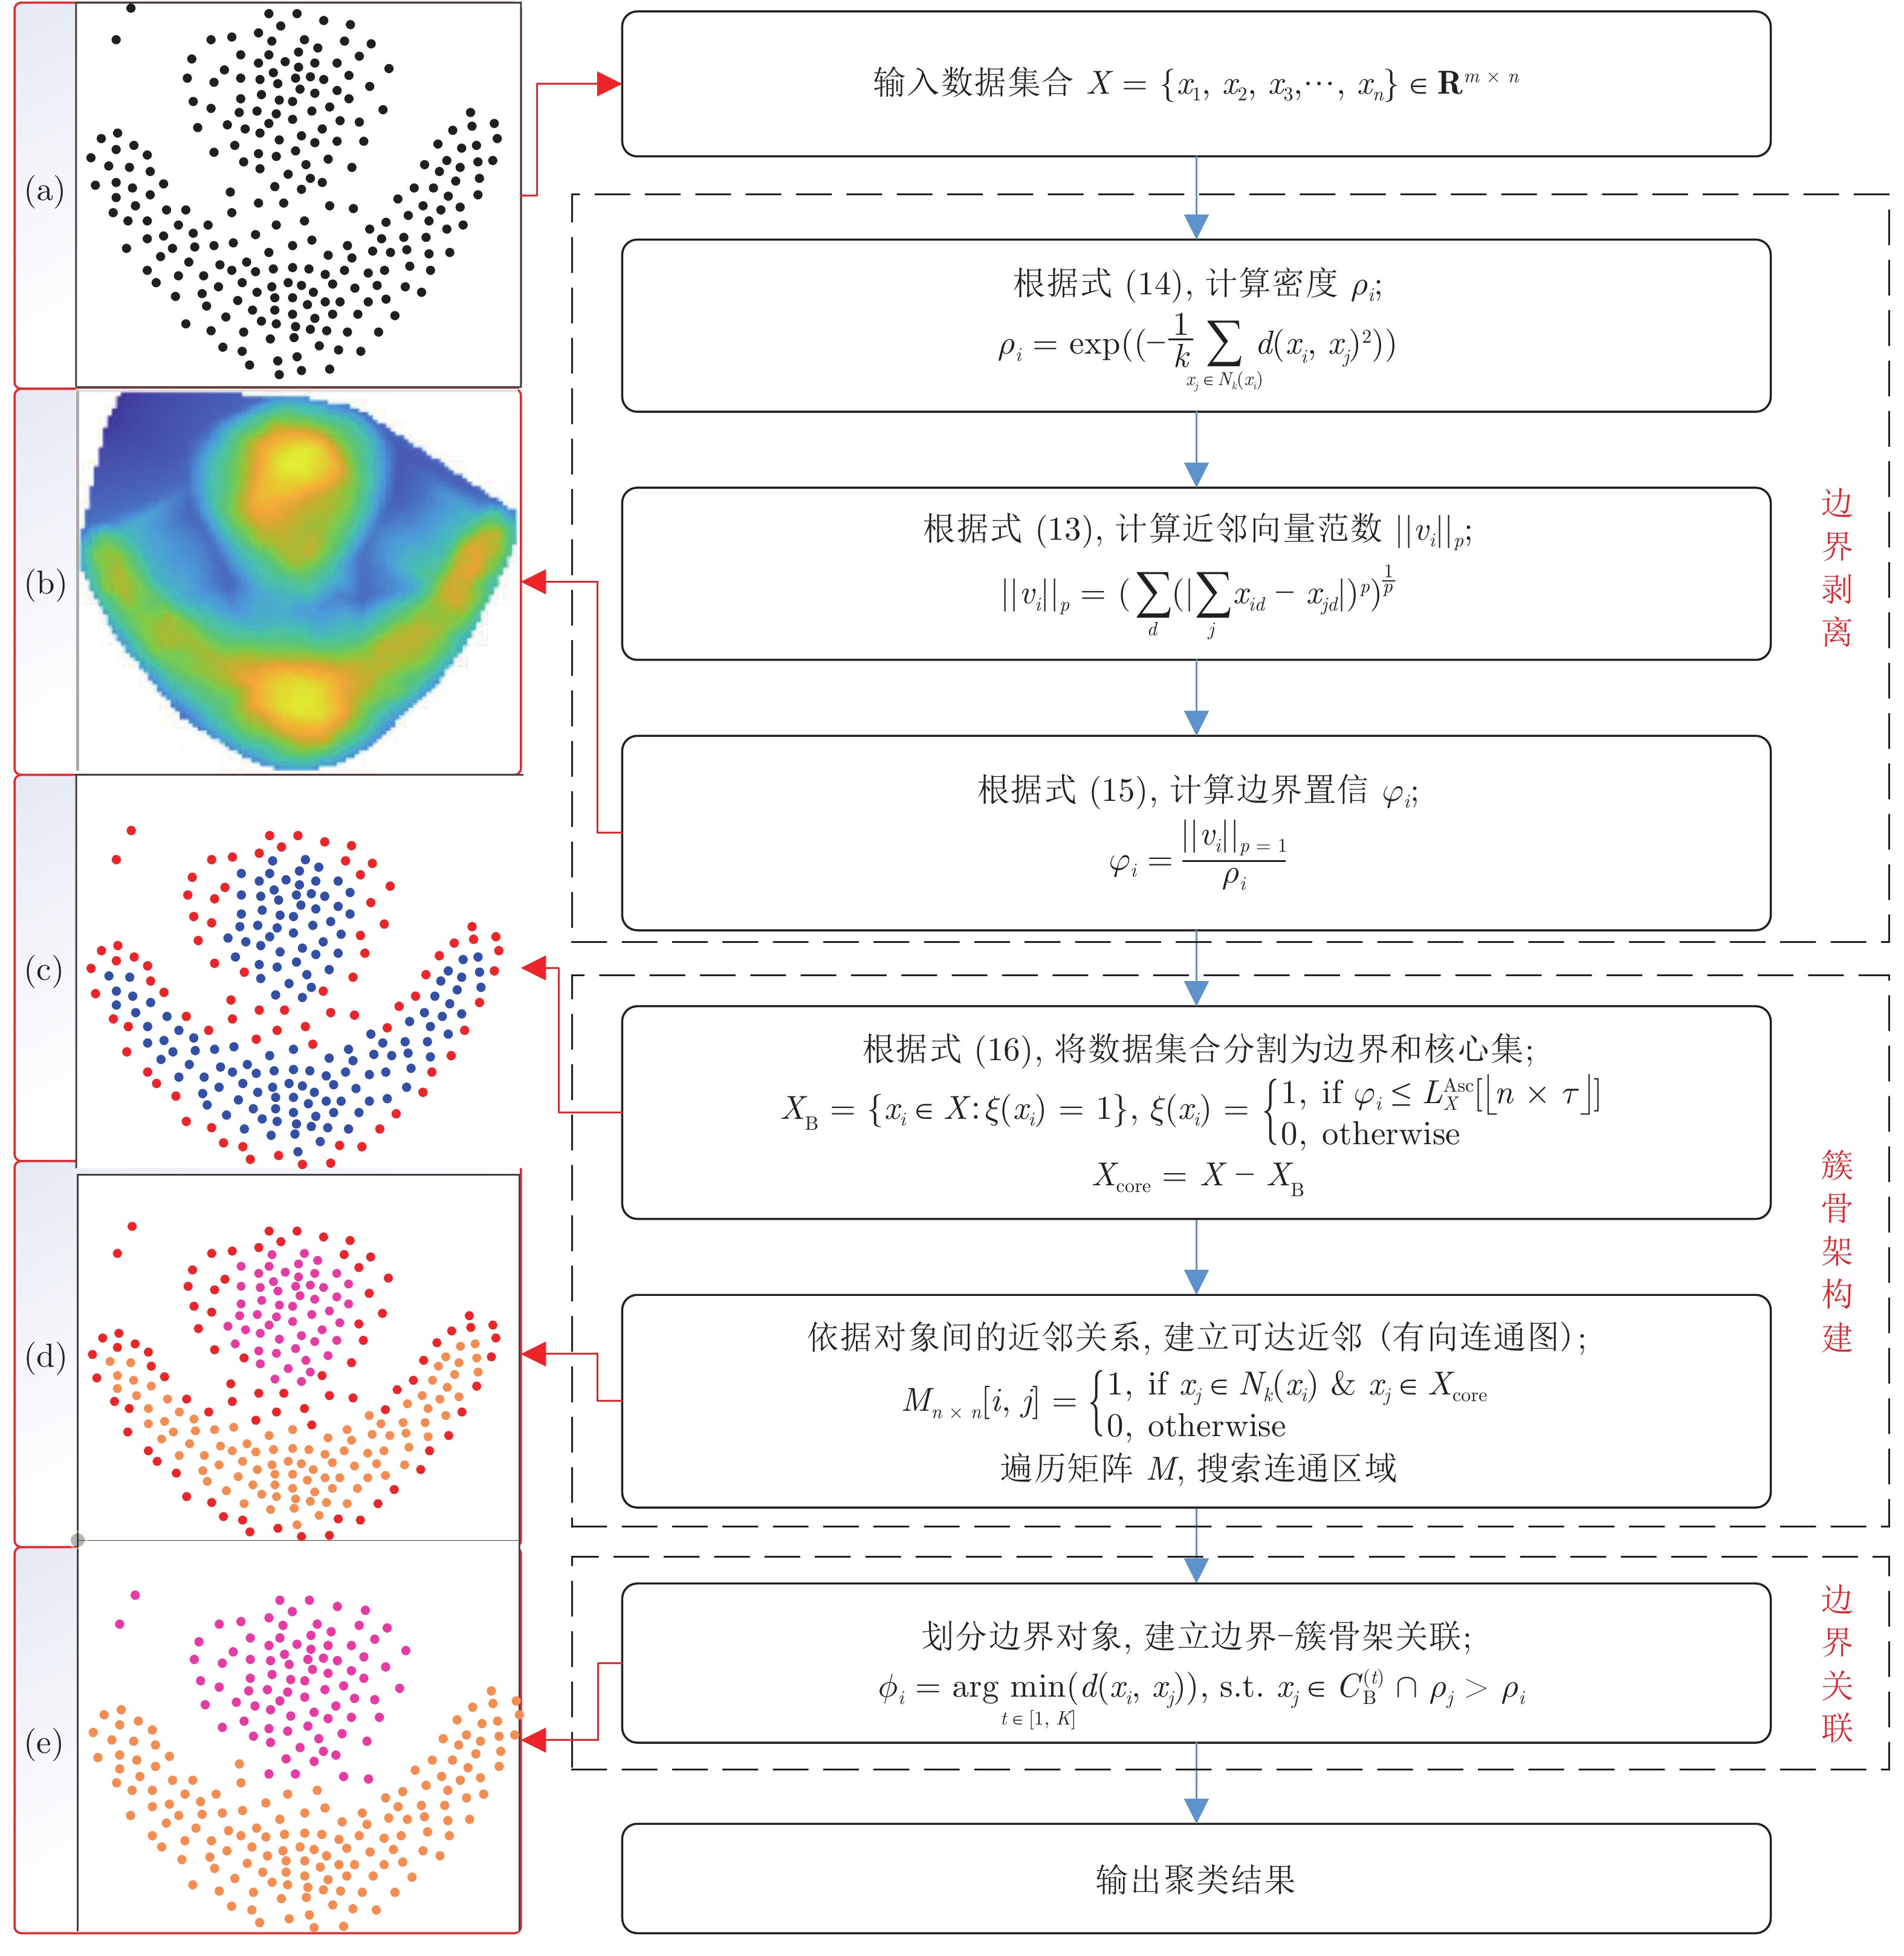
摘要: 作为聚类的重要组成部分, 边界点在引导聚类收敛和提升模式识别能力方面起着重要作用, 以BP (Border-peeling clustering)为最新代表的边界剥离聚类借助潜在边界信息来确保簇核心区域的空间隔离, 提高了簇骨架代表性并解决了边界隶属问题. 然而, 现有边界剥离聚类仍存在判别特征不完备、判别模式单一、嵌套迭代等约束. 为此, 提出了基于空间向量分解的边界剥离密度聚类(Density clustering based on the border-peeling using space vector decomposition, CBPVD), 以投影子空间和原始数据空间为基准, 从分布稀疏性(紧密性)和方向偏斜性(对称性)两个视角强化边界的细粒度特征, 进而通过主动边界剥离反向建立簇骨架并指导边界隶属. 与同类算法相比, 40个数据集(人工、UCI、视频图像)上的实验结果以及4个视角的理论分析表明了CBPVD在高维聚类和边界模式识别方面具有良好的综合表现.Abstract: Border points, as an essential part of density clustering, play a key role in guiding clustering convergence and improving pattern recognition ability. Indeed, the border-peeling clustering with BP (border-peeling clustering) as the latest representative ensures the spatial isolation of core region of the cluster by using intrinsic boundary information, then enhancing the cluster backbone. Nevertheless, the performance of available methods tends to be constrained by incomplete discriminant feature, single pattern and multiple iterations. To this end, this paper proposes a novel algorithm named CBPVD (density clustering based on the border-peeling using space vector decomposition). The property of CBPVD is based on the projection subspace and original space to enhance the fine-grained feature representation of the border point from the two perspectives of sparsity (compactness) and skewness (symmetry) of distribution, then reversely establishes the cluster backbone through active boundary peeling and guides the boundary membership. Finally, we compare performance of CBPVD with six state-of-the-art methods over synthetic, UCI, and image datasets. Experiments on 40 datasets and discussion cases from 4 perspectives demonstrate that our algorithm is feasible and effective in clustering and boundary pattern recognition.
-
Key words:
- Clustering /
- space vector decomposition /
- border-peeling /
- projection subspace /
- high dimension /
- density
-
表 1 参数设置
Table 1 Hyperparameter configuration
Algorithm Time complexity K-means $k$= The actual number of clusters DPC $dc\in [0.1,20]$ SNN-DPC $k\in [3,70]$ GB-DPC $dc\in [0.1,20] $ EC $dc\in [0.1,20]$ or $dc\in [100,300]$ BP $k\in[3,70], b\in[0.1,0.5], \epsilon\in[0.1,0.5], T\in[100,120],C=2$ CBPVD $k\in[3,70], \tau\in[0.1,0.4]$  下载: 导出CSV
表 2 数据集基本信息
Table 2 Basic information of datasets
数据集 大小 维度 簇数 特征 Compound 399 2 6 Multi-density, -Scale R15 600 2 15 Micro, Adjoining Flame 240 2 2 Overlapping Parabolic 2000 2 2 Cross-winding, Multi-density Jain 373 2 2 Cross-winding, Multi-density 4k2-far 400 2 4 Noise, Convex D31 3100 2 31 Multiple-Micro cluster Aggregation 788 2 7 Bridging Spiral 240 2 3 Manifold Heart disease 303 13 2 UCI, Clinical medicine Hepatitis 155 19 2 UCI, Clinical medicine German Credit 1000 20 2 UCI, Financial Voting 435 16 2 UCI, Political election Credit Approval 690 15 2 UCI, Credit record Bank 4521 16 2 UCI, Financial credit Sonar 208 60 2 UCI, Geology exploration Zoo 101 7 16 UCI, Biological species Parkinson 195 22 2 UCI, Clinical medicine Post 90 8 3 UCI, Postoperative recovery Spectheart 267 22 2 UCI, Clinical medicine Wine 178 13 3 UCI, Wine ingredients Ionosphere 351 34 2 UCI, Atmospheric structure WDBC 569 30 2 UCI, Cancer Optical Recognition 5620 64 10 OCR, Handwritten Digits Olivetti Face 400 10304 40 Face, High-dimensional You-Tube Faces 10000 10000 41 Video stream, Face RNA-seq 801 20531 5 Gene expression, Nonlinear REUTERS 10000 10000 4 Word, News, Text G2-20 2048 2 2 Noise-20% G2-30 2048 2 2 Noise-30% G2-40 2048 2 2 Noise-40% Size500 500 2 5 Gaussian Size2500 2500 2 5 Gaussian Size5000 5000 2 5 Gaussian Size10000 10000 2 5 Gaussian Dim128 1024 128 16 High-dimensional Dim256 1024 256 16 High-dimensional Dim512 1024 512 16 High-dimensional Dim1024 1024 1024 16 High-dimensional MINST 10000 784 10 OCR, high-dimensional
下载: 导出CSV
表 3 算法在合成数据集上的聚类表现
Table 3 Performance comparison of algorithms on all synthetic datasets
Dataset Algorithm Parameter ACC Purity JC ARI FMI 4k2-far K-means $k$= 4 1 1 0.13 1 1 DPC $dc$= 0.2168 1 1 1 1 1 GB-DPC $dc$= 0.5 1 1 0.26 1 1 SNN-DPC $k$= 10 1 1 1 1 1 EC $\sigma$= 1 1 1 1 1 1 BP — 0.98 0.99 0.01 0.97 0.98 CBPVD 10, 0.1 1 1 1 1 1 Aggregation K-means $k$= 7 0.78 0.94 0 0.76 0.81 DPC $k$= 7, $dc$= 2.5 0.91 0.95 0.22 0.84 0.87 GB-DPC $dc$= 2.5 0.64 0.99 0.09 0.57 0.68 SNN-DPC $k$= 40 0.98 0.98 0 0.96 0.97 EC $\sigma$= 5.5 1 1 0 1 1 BP — 1 0.95 0.72 0.99 0.99 CBPVD 16, 0.24 1 1 1 1 1 Compound K-means $k$= 6 0.63 0.83 0.23 0.53 0.63 DPC $dc$= 1.25 0.64 0.83 0.15 0.54 0.64 GB-DPC $dc$= 1.8 0.68 0.83 0.23 0.54 0.64 SNN-DPC $k$= 12 0.76 0.84 0.24 0.63 0.74 EC $\sigma$= 5.8 0.68 0.86 0.68 0.59 0.69 BP — 0.77 0.91 0.77 0.65 0.73 CBPVD 9, 0.08 0.90 0.91 0.13 0.94 0.96 Flame K-means $k$= 2 0.83 0.83 0.83 0.43 0.73 DPC $dc$= 0.93 0.84 0.84 0.16 0.45 0.74 GB-DPC $dc$= 2 0.99 0.99 0.99 0.97 0.98 SNN-DPC $k$= 5 0.99 0.99 0.01 0.95 0.98 EC $\sigma$= 5.4 0.80 0.93 0.14 0.51 0.74 BP — 0.98 0.99 0.65 0.96 0.98 CBPVD 3, 0.11 1 1 1 1 1 Spiral K-means $k$= 3 0.35 0.35 0.33 −0.01 0.33 DPC $dc$= 1.74 0.49 0.49 0.35 0.06 0.38 GB-DPC $dc$= 2.95 0.44 0.44 0.36 0.02 0.35 SNN-DPC $k$= 10 1 1 0 1 1 EC $\sigma$= 10 0.34 0.34 0.32 0 0.58 BP — 0.50 0.56 0.50 0.17 0.49 CBPVD 5, 0.32 1 1 1 1 1 Jain K-means $k$= 2 0.79 0.79 0.21 0.32 0.70 DPC $dc$= 1.35 0.86 0.86 0.86 0.52 0.79 GB-DPC $dc$= 1.35 0.35 0.94 0.18 0.15 0.44 SNN-DPC $k$= 10 0.86 0.86 0.14 0.52 0.79 EC $\sigma$= 7.65 0.79 0.86 0.19 0.51 0.78 BP — 0.42 0.98 0.09 0.23 0.53 CBPVD 13, 0.16 1 1 0 1 1 R15 K-means $k$= 15 0.81 0.86 0.03 0.80 0.81 DPC $dc$= 0.95 0.99 0.99 0 0.98 0.98 GB-DPC $dc$= 0.2 0.99 0.99 0.07 0.99 0.99 SNN-DPC $k$= 15 0.99 0.99 0.99 0.99 0.99 EC $\sigma$= 1.45 0.98 0.98 0.98 0.97 0.97 BP — 0.99 0.99 0 0.99 0.99 CBPVD 9, 0.13 1 1 1 1 1 Parabolic K-means $k$= 2 0.81 0.81 0.81 0.39 0.69 DPC $dc$= 1.5 0.82 0.82 0.82 0.41 0.71 GB-DPC $dc$= 0.5 0.94 0.94 0.06 0.77 0.89 SNN-DPC $k$= 9 0.95 0.95 0.95 0.81 0.91 EC $\sigma$= 3.05 0.73 0.73 0.73 0.21 0.66 BP — 0.19 0.98 0.03 0.13 0.36 CBPVD 33, 0.27 1 1 1 1 1 D31 K-means $k$= 31 0.88 0.91 0 0.87 0.87 DPC $dc$= 1.8 0.97 0.97 0 0.94 0.94 GB-DPC $dc$= 4 0.46 0.46 0.02 0.32 0.45 SNN-DPC $k$= 40 0.97 0.97 0 0.94 0.94 EC $\sigma$= 4 0.91 0.91 0.06 0.88 0.89 BP — 0.94 0.95 0 0.90 0.91 CBPVD 13, 0.15 0.97 0.97 0.07 0.94 0.94
下载: 导出CSV
表 4 算法在16个真实数据集(UCI)上的聚类表现
Table 4 Performance comparison of algorithms on 16 real-world datasets
Dataset Algorithm Parameter ACC Purity JC ARI FMI Heart disease K-means $k$= 2 0.57 0.57 0.57 0.02 0.52 DPC $dc$= 19.4424 0.55 0.55 0.45 0.01 0.51 GB-DPC $dc$= 19.4424 0.54 0.54 0.54 0 0.71 SNN-DPC $k$= 65 0.59 0.59 0.41 0.03 0.54 EC $\sigma$= 100 0.54 0.54 0.46 −0.001 0.71 BP — 0.53 0.54 0.47 −0.002 0.68 CBPVD 0.27, 26 0.68 0.68 0.32 0.12 0.77 Hepatitis K-means $k$= 2 0.66 0.84 0.66 −0.02 0.67 DPC $dc$= 1 0.63 0.84 0.01 −0.11 0.61 GB-DPC $dc$= 10.2 0.73 0.70 0.28 −0.01 0.72 SNN-DPC $k$= 45 0.70 0.84 0.30 −0.07 0.71 EC $\sigma$= 5.8 0.01 1 0.01 0 0.01 BP — 0.83 0.84 0.83 −0.02 0.84 CBPVD 10, 0.2 0.84 0.84 0.76 0 0.85 German K-means 2 0.67 0.70 0.33 0.05 0.66 DPC $dc$= 53.9814 0.61 0.70 0.61 0.03 0.58 GB-DPC $dc$= 53.9814 0.61 0.70 0.61 0.03 0.58 SNN-DPC $k$= 30 0.62 0.70 0.39 0.01 0.61 EC $\sigma$= 100 0.15 0.72 0.01 0.01 0.20 BP — 0.14 0.70 0.07 0.001 0.20 CBPVD 4, 0.39 0.83 0.83 0.83 0.43 0.74 Voting K-means $k$= 2 0.51 0.61 0.51 −0.002 0.51 DPC $dc$= 1 0.81 0.81 0.19 0.39 0.7 GB-DPC $dc$= 1.7 0.87 0.87 0.87 0.54 0.78 SNN-DPC $k$= 60 0.88 0.88 0.12 0.57 0.79 EC $\sigma$= 2 0.75 0.89 0.75 0.42 0.68 BP — 0.86 0.91 0.05 0.59 0.79 CBPVD 66, 0.33 0.88 0.88 0.12 0.68 0.79 Credit K-means $k$= 2 0.55 0.55 0.45 0.003 0.71 DPC $dc$= 1 0.68 0.68 0.68 0.13 0.60 GB-DPC $dc$= 7 0.55 0.55 0.45 0 0.71 SNN-DPC $k$= 50 0.61 0.61 0.61 0.05 0.53 EC $\sigma$= 800 0.56 0.59 0 0.02 0.68 BP — 0.33 0.69 0.26 0.06 0.35 CBPVD 31, 0.33 0.85 0.85 0.85 0.49 0.74 Bank K-means $k$= 2 0.82 0.88 0.11 −0.002 0.82 DPC $dc$= 2.39 0.64 0.88 0.14 0.04 0.65 GB-DPC $dc$= 10 0.76 0.74 0.24 −0.02 0.76 SNN-DPC $k$= 3 0.81 0.88 0.81 0.01 0.81 EC $\sigma$= 300 0.82 0.82 0 0.02 0.82 BP — 0.24 0.88 0.09 0.01 0.29 CBPVD 24, 0.2 0.88 0.88 0.12 0 0.89 Sonar K-means $k$= 2 0.54 0.54 0.34 0.50 0.50 DPC $dc$= 2.82 0.58 0.58 0.42 0.02 0.66 GB-DPC $dc$= 1.4 0.51 0.53 0.51 −0.004 0.51 SNN-DPC $k$= 19 0.50 0.53 0.50 −0.01 0.51 EC $\sigma$= 1.6 0.54 0.57 0.07 0.01 0.66 BP — 0.51 0.53 0.51 −0.004 0.68 CBPVD 9, 0.66 0.66 0.66 0.66 0.10 0.60 ZOO K-means $k$= 7 0.76 0.84 0.62 0.6 0.69 DPC $dc$= 2.4 0.70 0.79 0.36 0.59 0.68 GB-DPC $dc$= 3.6 0.66 0.75 0.03 0.48 0.60 SNN-DPC $k$= 5 0.56 0.56 0.12 0.31 0.53 EC $\sigma$= 2.3 0.80 0.81 0.08 0.65 0.73 BP — 0.59 0.59 0.23 0.4 0.62 CBPVD 10, 0.15 0.86 0.86 0.01 0.93 0.94 Parkinson K-means $k$= 2 0.72 0.75 0.28 0 0.74 DPC $dc$= 1.3 0.66 0.75 0.34 0.05 0.63 GB-DPC $dc$= 3 0.71 0.71 0.29 −0.05 0.75 SNN-DPC $k$= 80 0.72 0.75 0.28 0.11 0.69 EC $\sigma$= 135 0.70 0.75 0.7 0.14 0.66 BP — 0.19 0.98 0.03 0.13 0.36 CBPVD 13, 0.16 0.82 0.82 0.82 0.25 0.81 POST K-means $k$= 3 0.43 0.71 0.43 −0.002 0.45 DPC $dc$= 1 0.53 0.71 0.53 −0.01 0.52 GB-DPC $dc$= 2.7 0.61 0.71 0.38 −0.03 0.62 SNN-DPC $k$= 60 0.61 0.71 0.61 0.02 0.60 EC $\sigma$= 6 0.70 0.72 0.05 0.04 0.74 BP — 0.62 0.72 0.09 0.04 0.61 CBPVD 10, 0.01 0.79 0.79 0.79 0.25 0.78 Spectheart K-means $k$= 2 0.64 0.92 0.64 −0.05 0.69 DPC $dc$= 1.4142 0.52 0.92 0.48 −0.01 0.65 GB-DPC $dc$= 1.1 0.52 0.92 0.08 0 0.92 SNN-DPC $k$= 80 0.87 0.92 0.13 0.11 0.87 EC $\sigma$= 4 0.92 0.92 0.08 0 0.92 BP — 0.91 0.92 0.91 −0.01 0.91 CBPVD 15, 0.26 0.92 0.92 0.08 0 0.92 Wine K-means $k$= 4 0.66 0.70 0.11 0.32 0.54 DPC $dc$= 0.5 0.55 0.58 0.43 0.15 0.57 GB-DPC $dc$= 5.6 0.60 0.71 0.35 0.27 0.50 SNN-DPC $k$= 3 0.62 0.66 0.51 0.34 0.63 EC $\sigma$= 250 0.66 0.66 0.66 0.37 0.66 BP — 0.68 0.71 0.21 0.34 0.56 CBPVD 4, 0.03 0.91 0.95 0.75 0.8 0.87 Ionosphere K-means $k$= 2 0.71 0.71 0.71 0.18 0.61 DPC $dc$= 3.7 0.65 0.65 0.35 0.02 0.73 GB-DPC $dc$= 3.7 0.65 0.65 0.35 0.02 0.73 SNN-DPC $k$= 34 0.67 0.67 0.67 0.11 0.57 EC $\sigma$= 5 0.65 0.67 0 0.05 0.73 BP — 0.80 0.80 0.80 0.34 0.76 CBPVD 6, 0.51 0.83 0.83 0.87 0.42 0.77 WDBC K-means $k$= 2 0.74 0.89 0.22 0.54 0.76 DPC $dc$= 5 0.67 0.67 0.67 0.10 0.60 GB-DPC $dc$= 3.9 0.63 0.63 0.63 0 0.73 SNN-DPC $k$= 3 0.81 0.81 0.19 0.36 0.75 EC $\sigma$= 350 0.82 0.87 0 0.49 0.78 BP — 0.44 0.88 0.12 0.25 0.52 CBPVD 3, 0.6 0.95 0.95 0.05 0.81 0.91 RNN-seq K-means $k$= 5 0.75 0.75 0.17 0.72 0.79 DPC $dc$= 159.6 0.70 0.73 0.39 0.62 0.76 GB-DPC $dc$= 159.6 0.73 0.73 0.54 0.63 0.77 SNN-DPC $k$= 30 0.73 0.73 0.001 0.51 0.71 EC $\sigma$= 240 0.38 0.38 0.17 0 0.49 BP — 0.78 0.74 0.002 0.63 0.72 CBPVD 10, 0.4 0.996 0.996 0.81 0.99 0.99 REUTERS K-means $k$= 4 0.50 0.58 0.22 0.15 0.41 DPC $dc$= 3.5 0.43 0.43 0.28 0.10 0.46 GB-DPC $dc$= 3.5 0.35 0.55 0 0.14 0.41 SNN-DPC $k$= 40 0.49 0.50 0.49 0.24 0.54 EC $\sigma$= 300 0.40 0.40 0.40 0 0.55 BP — 0.39 0.41 0.38 0.01 0.50 CBPVD 20, 0.1 0.61 0.61 0.61 0.23 0.47
下载: 导出CSV
表 5 图像数据集的聚类结果
Table 5 Performance comparison of algorithms on image datasets
Dataset Algorithm Parameter ACC Purity JC ARI FMI Olivetti K-means $k$= 40 0.64 0.67 0.01 0.517 0.54 DPC $dc$= 0.922 0.59 0.65 0.02 0.523 0.56 GB-DPC $dc$= 0.65 0.65 0.73 0.05 0.577 0.59 SNN-DPC $k$= 40 0.66 0.74 0 0.585 0.61 EC $\sigma$= 3700 0.44 0.58 0.02 0.22 0.32 BP — 0.03 0.03 0.03 0 0.15 CBPVD 4, 0.14 0.75 0.78 0 0.646 0.68 Optical K-means $k$= 10 0.71 0.73 0.04 0.58 0.63 DPC $dc$= 1.1 0.60 0.62 0.09 0.475 0.56 GB-DPC $dc$= 10.5 0.61 0.62 0.02 0.468 0.56 SNN-DPC $k$= 10 0.71 0.73 0.20 0.629 0.69 EC $\sigma$= 30 0.69 0.69 0.17 0.596 0.67 BP — 0.80 0.85 0 0.717 0.75 CBPVD 4, 0.45 0.93 0.95 0.30 0.889 0.90 You-Tube Faces K-means $k$= 41 0.52 0.63 0.02 0.51 0.53 DPC $dc$= 6.5 0.53 0.62 0.02 0.48 0.51 GB-DPC $dc$= 6.5 0.31 0.31 0 0.25 0.35 SNN-DPC $k$= 59 0.57 0.69 0.03 0.47 0.50 EC $\sigma$= 100 0.51 0.56 0.01 0.40 0.46 BP — 0.52 0.62 0.04 0.19 0.32 CBPVD 20, 0.1 0.66 0.88 0.01 0.62 0.64
下载: 导出CSV
表 6 复杂度对比
Table 6 The time complexity of algorithms
Algorithm Time complexity DBSACN $\text{O}(n^2)$ DPC $\text{O}(n^2)$ GB-DPC $\text{O}(n\log_2n)$ SNN-DPC $\text{O}(n^2)$ DPC-RDE $\text{O}(n^2)$ RA-Clust $\text{O}(n\sqrt{n})$ EC $\text{O}(n^2)$ BP $\text{O}(n^2)$ CBPVD $\text{O}(n^2)$
下载: 导出CSV
-
[1] 朱颖雯, 陈松灿. 基于随机投影的高维数据流聚类. 计算机研究与发展, 2020, 57(8): 1683-1696 doi: 10.7544/issn1000-1239.2020.20200432Zhu Ying-Wen, Chen Song-Can. High dimensional data stream clustering algorithm based on random projection. Journal of Computer Research and Development, 2020, 57(8): 1683-1696 doi: 10.7544/issn1000-1239.2020.20200432 [2] Xia S Y, Peng D W, Meng D Y, Zhang C Q, Wang G Y, Giem E, et al. Ball k k-means: fast adaptive clustering with no bounds. IEEE Transactions on Pattern Analysis & Machine Intelligence, 2022, 44(01): 87-99 [3] Rodriguez A, Laio A. Clustering by fast search and find of density peaks. Science, 2014, 344(6191): 1492-1469 doi: 10.1126/science.1242072 [4] Flores K G, Garza S E. Density peaks clustering with gap-based automatic center detection. Knowledge-Based Systems, 2020, 206: Article No. 160350 [5] Wang S L, Li Q, Zhao C F, Zhu X Q, Yuan H N, Dai T R. Extreme clustering–a clustering method via density extreme points. Information Sciences, 2021, 542: 24-39 doi: 10.1016/j.ins.2020.06.069 [6] Hou J, Zhang A H, Qi N M. Density peak clustering based on relative density relationship. Pattern Recognition, 2020, 108: Article No. 107554 [7] Xu X, Ding S F, Wang Y R, Wang L J, Jia W K. A fast density peaks clustering algorithm with sparse search. Information Sciences, 2021, 554: 61-83 doi: 10.1016/j.ins.2020.11.050 [8] Weng S Y, Gou J, Fan Z W. h-DBSCAN: A simple fast DBSCAN algorithm for big data. In: Proceedings of Asian Conference on Machine Learning. New York, USA: PMLR, 2021. 81−96 [9] Ester M, Kriegel H, Sander J, Xu X W. A density-based algorithm for discovering clusters in large spatial databases with noise. In: Proceedings of Knowledge Discovery and Data Mining. New York, USA: ACM, 1996. 226−231 [10] Fang F, Qiu L, Yuan S F. Adaptive core fusion-based density peak clustering for complex data with arbitrary shapes and densities. Pattern Recognition, 2020, 107: Article No. 107452 [11] Chen M, Li L J, Wang B, Cheng J J, Pan L N, Chen X Y. Effectively clustering by finding density backbone based-on kNN. Pattern Recognition, 2016, 60: 486-498 doi: 10.1016/j.patcog.2016.04.018 [12] Averbuch-Elor H, Bar N, Cohen-Or D. Border peeling clustering. IEEE Transactions on Pattern Analysis and Machine Intelligence, 2019, 42(7): 1791-1797 [13] Cao X F, Qiu B Z, Li X L, Shi Z L, Xu G D, Xu J L. Multidimensional balance-based cluster boundary detection for high-dimensional data. IEEE Transactions on Neural Networks and Learning Systems, 2018, 30(6): 1867-1880 [14] Qiu B Z, Cao X F. Clustering boundary detection for high dimensional space based on space inversion and Hopkins statistics. Knowledge-Based Systems, 2016, 98: 216-225 doi: 10.1016/j.knosys.2016.01.035 [15] Zhang R L, Song X H, Ying S R, Ren H L, Zhang B Y, Wang H P. CA-CSM: a novel clustering algorithm based on cluster center selection model. Soft Computing, 2021, 25(13): 8015-8033 doi: 10.1007/s00500-021-05835-w [16] Li X L, Han Q, Qiu B Z. A clustering algorithm using skewness-based boundary detection. Neurocomputing, 2018, 275: 618-626 doi: 10.1016/j.neucom.2017.09.023 [17] Yu H, Chen L Y, Yao J T. A three-way density peak clustering method based on evidence theory. Knowledge-Based Systems, 2021, 211: Article No. 106532 [18] Tong Q H, Li X, Yuan B. Efficient distributed clustering using boundary information. Neurocomputing, 2018, 275: 2355-2366 doi: 10.1016/j.neucom.2017.11.014 [19] Zhang S Z, You C, Vidal R, Li C G. Learning a self-expressive network for subspace clustering. In: Proceedings of the IEEE Conference on Computer Vision and Pattern Recognition. New York, USA: IEEE, 2021. 12393−12403 [20] MacQueen J. Classification and analysis of multivariate observations. In: Proceedings of the 5th Berkeley Symp. Math. Statist. Probability. Berkeley, USA: University of California Press, 1967. 281−297 [21] Liu R, Wang H, Yu X M. Shared-nearest-neighbor-based clustering by fast search and find of density peaks. Information Sciences, 2018, 450: 200-226 doi: 10.1016/j.ins.2018.03.031 [22] Gong C Y, Su Z G, Wang P H, Wang Q. Cumulative belief peaks evidential K-nearest neighbor clustering. Knowledge-Based Systems, 2020, 200: Article No. 105982 [23] 邱保志, 张瑞霖, 李向丽. 基于残差分析的混合属性数据聚类算法. 自动化学报, 2020, 46(7): 1420-1432 doi: 10.16383/j.aas.2018.c180030QIU Bao-Zhi, ZHANG Rui-Lin, LI Xiang-Li. Clustering algorithm for mixed data based on residual analysis. Acta Automatica Sinica, 2020, 46(7): 1420-1432 doi: 10.16383/j.aas.2018.c180030 [24] Zhang R L, Miao Z G, Tian Y, Wang H P. A novel density peaks clustering algorithm based on Hopkins statistic. Expert Systems with Applications, 2022, 201: Article No. 116892 [25] Liu Y H, Ma Z M, Yu F. Adaptive density peak clustering based on K-nearest neighbors with aggregating strategy. Knowledge-Based Systems, 2017, 133: 208-220 doi: 10.1016/j.knosys.2017.07.010 [26] Abbas M, El-Zoghabi A, Shoukry A. DenMune: Density peak based clustering using mutual nearest neighbors. Pattern Recognition, 2021, 109: Article No. 107589 [27] Ren Y Z, Hu X H, Shi K, Yu G X, Yao D Z, Xu Z L. Semi-supervised denpeak clustering with pairwise constraints. In: Proceedings of Pacific Rim International Conference on Artificial Intelligence. Cham, Switzerland: Springer, 2018. 837−850 [28] Ren Y Z, Wang N, Li M X, Xu Z L. Deep density-based image clustering. Knowledge-Based Systems, 2020, 197: 105841 doi: 10.1016/j.knosys.2020.105841 [29] Gao T F, Chen D, Tang Y B, Du B, Ranjan R, Zomaya A Y. Adaptive density peaks clustering: Towards exploratory EEG analysis. Knowledge-Based Systems, 2022, 240: Article No. 108123 [30] Xu J, Wang G Y, Deng W H. DenPEHC: density peak based efficient hierarchical clustering. Information Sciences, 2016, 373: 200-218 doi: 10.1016/j.ins.2016.08.086 [31] Ren Y Z, Kamath U, Domeniconi C, Zhang G J. Boosted mean shift clustering. In: Proceedings of Joint European Conference on Machine Learning and Knowledge Discovery in Databases. Berlin, German: Springer, 2014. 646−661 [32] Lotfi A, Moradi P, Beigy H. Density peaks clustering based on density backbone and fuzzy neighborhood. Pattern Recognition, 2020, 107: Article No. 107449 [33] Teng Q, Yong J L. Fast LDP-MST: An efficient density-peak-based clustering method for large-size datasets. IEEE Transactions on Knowledge and Data Engineering, DOI: 10.1109/TKDE.2022.3150403 [34] Brooks J K. Decomposition theorems for vector measures. Proceedings of the American Mathematical Society, 1969, 21(1): 27-29 doi: 10.1090/S0002-9939-1969-0237743-1 -

 下载:
下载:


计量
- 文章访问数: 1065
- HTML全文浏览量: 353
- PDF下载量: 167
- 被引次数: 0
