

Multi-subpopulation Based Symbiosis and Non-uniform Gaussian Mutation Salp Swarm Algorithm
-
摘要: 针对樽海鞘群算法求解精度不高和收敛速度慢等缺点, 提出一种多子群的共生非均匀高斯变异樽海鞘群算法. 根据不同适应度值将樽海鞘链群分为三个子种群, 各个子种群分别进行领导者位置更新、追随者共生策略和链尾者非均匀高斯变异等操作. 使用统计分析、收敛速度分析、Wilcoxon检验、经典基准函数和CEC 2014函数的标准差来评估改进樽海鞘群算法的效率. 结果表明, 改进算法具有更好的寻优精度和收敛速度. 尤其在求解高维和多峰测试函数上, 改进算法拥有更好性能.Abstract: In order to solve the problem that the standard salp swarm algorithm has a small convergent rate and low result precision in the evolutionary process, an improved algorithm called multi-subpopulation based symbiosis and non-uniform Gaussian mutation salp swarm algorithm (MSNSSA) is proposed in this paper. According to the different fitness values, the salp chain population is divided into three sub-populations, which perform the operations of leader position update, follower symbiosis strategy and chain tail non-uniform Gaussian mutation, respectively. The efficiency of the MSNSSA is evaluated using statistical analysis, convergence rate analysis, Wilcoxon's test, standard deviations on classical benchmark functions and modern CEC 2014 functions. The results show that the MSNSSA has better optimization accuracy and convergence rate. Especially, in solving the high-dimension and multimodal function optimization problem, the improved algorithm has better performance.
-
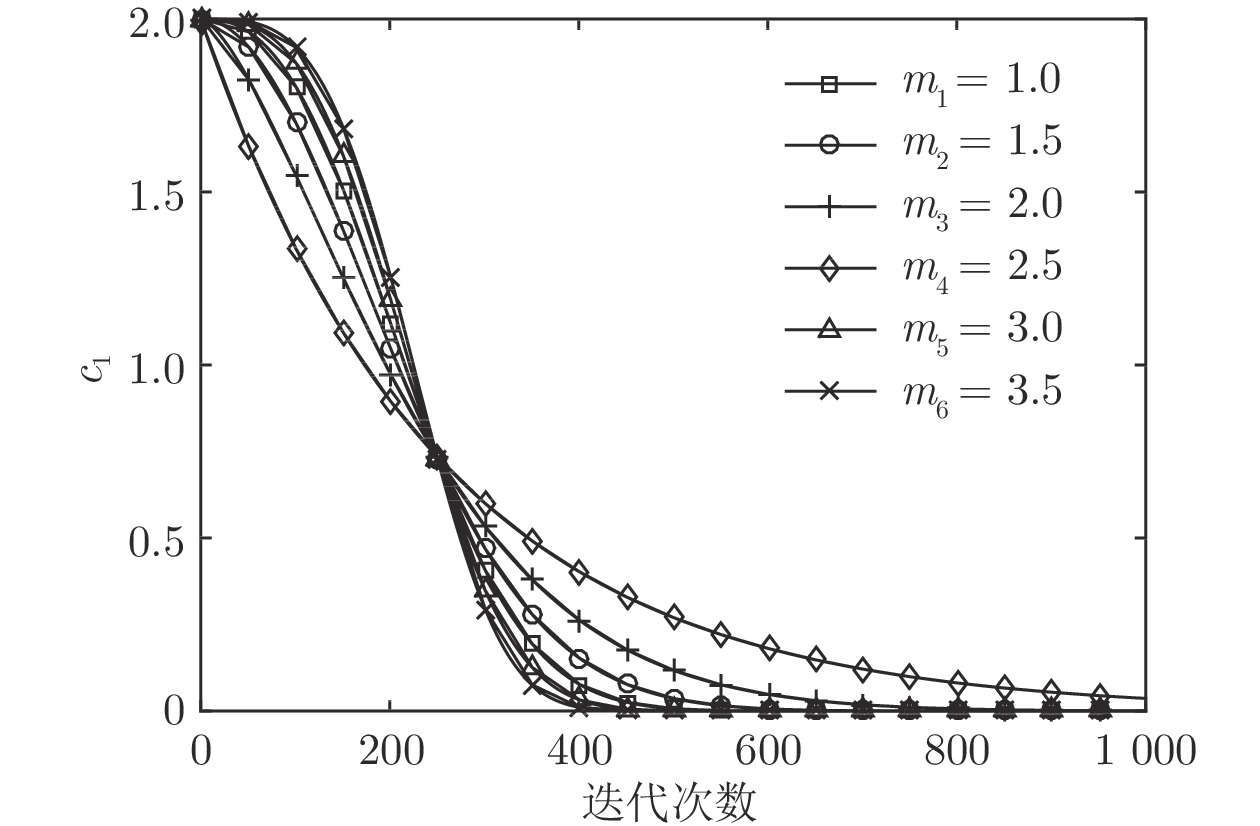
表 1 参数m对SSA的影响
Table 1 Influence of parameter m on SSA
m 最佳值 平均值 标准差 平均收敛代数 1.0 2.98 × 10⁻⁸ 1.40 × 10⁻³ 2.51 × 10⁻³ 883 1.5 4.67 × 10⁻⁹ 2.68 × 10⁻³ 4.34 × 10⁻³ 937 2.0 1.20 × 10⁻¹⁴ 3.41 × 10⁻³ 4.64 × 10⁻³ 975 2.5 0 0 0 847 3.0 9.72 × 10⁻³ 9.72 × 10⁻³ 2.08 × 10⁻¹⁷ 719 3.5 9.72 × 10⁻³ 9.72 × 10⁻³ 1.99 × 10⁻¹⁷ 621  下载: 导出CSV
表 2 基准函数
Table 2 Benchmark function
函数 维度 特征 定义域 最佳值 f1 Sphere 10 US [−100, 100] 0 f2 Schwefel 1.2 50 UN [−100, 100] 0 f3 Schwefel 2.21 50 US [−100, 100] 0 f4 Quartic 100 US [−1.28, 1.28] 0 f5 Rosenbrock 100 UN [−30, 30] 0 f6 Step 200 US [−100, 100] 0 f7 Schaffer 2 MN [−100, 100] 0 f8 Foxholes 2 MN [−65.56, 65.56] ≈1 f9 Kowalik 4 MN [−5, 5] 3.075×10⁻⁴ f10 Rastrigin 10 MS [−5.12, 5.12] 0 f11 Ackley 50 MN [−32, 32] 0 f12 Griewank 100 MN [−600, 600] 0 f13 Penalized1 100 MN [−50, 50] 0 f14 Penalized2 200 MN [−50, 50] 0
下载: 导出CSV
表 3 参数设置
Table 3 Parameter settings
算法 主要参数 MSNSSA m = 2.5, R = 1 或 2 SSSA m = 2.0, R = 1 或 2 NSSA m = 2.0 BOA p = 0.8, c = 0.01, a = 0.1 MFO — SCA a = 2 PSO c1 = c2 = 1.5
下载: 导出CSV
表 4 基准函数结果对比
Table 4 Comparison of benchmark function results
函数 算法 最佳值 平均值 标准差 SR (%) T (s) f1 MSNSSA 1.06 × 10⁻³⁴ 5.01 × 10⁻³⁰ 1.30 × 10⁻²⁹ 100 0.80 SSSA 1.53 × 10⁻¹⁸ 1.18 × 10⁻¹¹ 3.54 × 10⁻¹¹ 100 0.73 NSSA 3.46 × 10⁻²⁴ 7.94 × 10⁻¹⁵ 2.36 × 10⁻¹⁴ 100 0.56 SSA 2.52 × 10⁻¹⁰ 6.55 × 10⁻¹⁰ 2.35 × 10⁻¹⁰ 100 0.28 BOA 1.04 × 10⁻¹⁴ 1.50 × 10⁻¹⁴ 1.83 × 10⁻¹⁵ 100 0.44 MFO 1.06 × 10⁻³² 5.64 × 10⁻²⁹ 2.35 × 10⁻²⁸ 100 0.26 SCA 7.48 × 10⁻³² 2.18 × 10⁻²⁴ 1.02 × 10⁻²³ 100 0.23 PSO 4.39 × 10⁻⁵ 2.66 × 10⁻⁴ 2.10 × 10⁻⁴ 0 0.25 f2 MSNSSA 3.31 × 10⁻³⁰ 2.84 × 10⁻²⁷ 2.32 × 10⁻²⁷ 100 3.62 SSSA 4.95 × 10⁻¹⁴ 1.75 × 10⁻⁹ 3.26 × 10⁻⁹ 100 4.79 NSSA 1.91 × 10⁻²¹ 1.00 × 10⁻¹⁰ 4.20 × 10⁻¹⁰ 100 3.32 SSA 1.29 × 10³ 4.81 × 10³ 2.25 × 10³ 0 2.98 BOA 1.59 × 10⁻¹⁴ 1.85 × 10⁻¹⁴ 1.00 × 10⁻¹⁵ 100 5.67 MFO 2.21 × 10⁴ 5.52 × 10⁴ 2.49 × 10⁴ 0 3.09 SCA 1.08 × 10⁴ 3.41 × 10⁴ 1.46 × 10⁴ 0 3.05 PSO 7.10 × 101 1.68 × 10² 6.46 × 101 0 2.89 f3 MSNSSA 1.15 × 10⁻¹⁷ 2.71 × 10⁻¹⁶ 1.65 × 10⁻¹⁶ 100 1.03 SSSA 9.96 × 10⁻⁹ 3.87 × 10⁻⁶ 5.10 × 10⁻⁶ 82 0.99 NSSA 3.74 × 10⁻¹³ 1.55 × 10⁻⁸ 3.20 × 10⁻⁸ 100 0.78 SSA 1.11 × 101 1.82 × 101 3.61 × 100 0 0.47 BOA 1.04 × 10⁻¹¹ 1.21 × 10⁻¹¹ 8.36 × 10⁻¹³ 100 0.65 MFO 6.77 × 101 8.19 × 101 4.86 × 100 0 0.60 SCA 3.65 × 101 5.85 × 101 8.18 × 100 0 0.55 PSO 4.06 × 100 5.90 × 100 1.11 × 100 0 0.40 f4 MSNSSA 1.66 × 10⁻⁶ 1.16 × 10⁻⁵ 5.52 × 10⁻⁶ 38 1.78 SSSA 2.58 × 10⁻⁵ 1.66 × 10⁻⁴ 1.38 × 10⁻⁴ 0 2.03 NSSA 2.09 × 10⁻⁵ 2.84 × 10⁻⁴ 2.90 × 10⁻⁴ 0 1.53 SSA 8.23 × 10⁻¹ 1.36 × 100 3.27 × 10⁻¹ 0 1.18 BOA 1.36 × 10⁻⁴ 6.89 × 10⁻⁴ 3.33 × 10⁻⁴ 0 2.13 MFO 2.37 × 101 1.78 × 10² 1.20 × 10² 0 1.52 SCA 3.37 × 100 5.93 × 101 4.20 × 101 0 1.43 PSO 2.10 × 100 4.48 × 100 2.24 × 100 0 1.01 f5 MSNSSA 0 3.99 × 10⁻²⁸ 3.80 × 10⁻²⁸ 100 1.33 SSSA 9.77 × 101 9.78 × 101 8.27 × 10⁻² 0 1.30 NSSA 4.44 × 10⁻²⁷ 2.48 × 10⁻¹² 4.33 × 10⁻¹² 100 1.05 SSA 6.60 × 10² 2.20 × 10³ 2.71 × 10³ 0 0.68 BOA 9.89 × 101 9.89 × 101 2.86 × 10⁻² 0 1.23 MFO 3.03 × 10⁶ 7.18 × 10⁷ 5.39 × 10⁷ 0 1.02 SCA 2.19 × 10⁷ 6.79 × 10⁷ 3.34 × 10⁷ 0 0.93 PSO 6.47 × 10² 1.12 × 10³ 3.10 × 10² 0 0.52 f6 MSNSSA 0 4.56 × 10⁻²⁹ 3.92 × 10⁻²⁹ 100 1.58 SSSA 3.39 × 100 4.93 × 100 6.31 × 10⁻¹ 0 1.48 NSSA 2.85 × 10⁻²⁷ 2.27 × 10⁻¹³ 7.95 × 10⁻¹³ 100 1.30 SSA 2.16 × 10³ 3.34 × 10³ 6.74 × 10² 0 0.87 BOA 4.58 × 101 4.83 × 101 8.80 × 10⁻¹ 0 1.06 MFO 1.27 × 10⁵ 1.82 × 10⁵ 2.02 × 10⁴ 0 1.61 SCA 5.91 × 10³ 2.88 × 10⁴ 1.53 × 10⁴ 0 1.44
下载: 导出CSV
4 基准函数结果对比 (续表)
4 Comparison of benchmark function results (continued table)
函数 算法 最佳值 平均值 标准差 SR (%) T (s) f6 PSO 4.43 × 101 7.07 × 101 1.11 × 101 0 0.63 f7 MSNSSA 0 0 0 100 0.82 SSSA 0 8.61 × 10⁻¹³ 1.54 × 10⁻¹² 100 0.80 NSSA 0 1.60 × 10⁻¹⁴ 2.62 × 10⁻¹⁴ 100 0.59 SSA 3.66 × 10⁻¹⁴ 5.25 × 10⁻³ 4.89 × 10⁻³ 46 0.33 BOA 1.68 × 10⁻¹⁴ 1.04 × 10⁻² 4.35 × 10⁻³ 2 0.93 MFO 0 8.16 × 10⁻³ 3.60 × 10⁻³ 16 0.27 SCA 0 4.92 × 10⁻⁷ 3.48 × 10⁻⁶ 98 0.25 PSO 6.15 × 10⁻⁹ 3.30 × 10⁻³ 4.65 × 10⁻³ 62 0.30 f8 MSNSSA 9.98 × 10⁻¹ 9.98 × 10⁻¹ 6.34 × 10⁻¹⁷ 100 2.68 SSSA 9.98 × 10⁻¹ 9.98 × 10⁻¹ 2.21 × 10⁻¹⁶ 100 3.51 NSSA 9.98 × 10⁻¹ 9.98 × 10⁻¹ 1.21 × 10⁻¹⁶ 100 2.40 SSA 9.98 × 10⁻¹ 1.22 × 100 6.11 × 10⁻¹ 86 2.11 BOA 9.98 × 10⁻¹ 1.16 × 100 3.69 × 10⁻¹ 26 4.63 MFO 9.98 × 10⁻¹ 2.28 × 100 2.05 × 100 52 2.05 SCA 9.98 × 10⁻¹ 1.51 × 100 8.79 × 10⁻¹ 34 2.03 PSO 9.98 × 10⁻¹ 1.38 × 100 8.44 × 10⁻¹ 66 2.08 f9 MSNSSA 3.07 × 10⁻⁴ 3.08 × 10⁻⁴ 1.47 × 10⁻⁷ 8 0.96 SSSA 3.07 × 10⁻⁴ 4.29 × 10⁻⁴ 1.56 × 10⁻⁴ 0 0.98 NSSA 3.08 × 10⁻⁴ 4.48 × 10⁻⁴ 2.29 × 10⁻⁴ 0 0.71 SSA 4.83 × 10⁻⁴ 3.22 × 10⁻³ 6.40 × 10⁻³ 0 0.45 BOA 3.12 × 10⁻⁴ 3.66 × 10⁻⁴ 5.91 × 10⁻⁵ 0 1.17 MFO 3.20 × 10⁻⁴ 9.25 × 10⁻⁴ 3.45 × 10⁻⁴ 0 0.39 SCA 3.27 × 10⁻⁴ 8.72 × 10⁻⁴ 3.79 × 10⁻⁴ 0 0.37 PSO 3.22 × 10⁻⁴ 1.15 × 10⁻³ 2.80 × 10⁻³ 0 0.41 f10 MSNSSA 0 0 0 100 0.95 SSSA 0 9.59 × 10⁻¹¹ 1.35 × 10⁻¹⁰ 100 0.95 NSSA 0 6.62 × 10⁻¹⁴ 1.25 × 10⁻¹³ 100 0.71 SSA 1.99 × 100 5.33 × 100 1.27 × 100 0 0.43 BOA 0 2.93 × 101 1.81 × 101 20 1.10 MFO 5.97 × 100 2.32 × 101 1.22 × 101 0 0.40 SCA 0 6.31 × 10⁻¹ 3.16 × 100 90 0.38 PSO 3.01 × 100 1.01 × 101 4.25 × 100 0 0.38 f11 MSNSSA 4.44 × 10⁻¹⁵ 2.01 × 10⁻¹⁴ 1.77 × 10⁻¹⁴ 100 1.15 SSSA 1.14 × 10⁻⁸ 1.46 × 10⁻⁶ 2.17 × 10⁻⁶ 100 1.16 NSSA 4.44 × 10⁻¹⁵ 4.74 × 10⁻⁸ 7.31 × 10⁻⁸ 100 0.89 SSA 1.56 × 100 1.97 × 100 1.58 × 10⁻¹ 0 0.59 BOA 1.06 × 10⁻¹¹ 1.22 × 10⁻¹¹ 5.97 × 10⁻¹³ 100 1.25 MFO 1.09 × 101 1.91 × 101 1.81 × 100 0 0.72 SCA 3.55 × 10⁻² 1.70 × 101 7.24 × 100 0 0.69 PSO 4.48 × 100 6.78 × 100 1.03 × 100 0 0.50 f12 MSNSSA 0 0 0 100 1.50 SSSA 1.19 × 10⁻¹⁴ 4.83 × 10⁻¹⁰ 1.18 × 10⁻⁹ 100 1.57 NSSA 0 1.93 × 10⁻¹³ 4.31 × 10⁻¹³ 100 1.22 SSA 2.11 × 10⁻¹ 3.28 × 10⁻¹ 3.39 × 10⁻² 0 0.86 BOA 3.11 × 10⁻¹⁵ 1.34 × 10⁻¹⁴ 6.68 × 10⁻¹⁵ 100 1.51
下载: 导出CSV
4 基准函数结果对比 (续表)
4 Comparison of benchmark function results (continued table)
函数 算法 最佳值 平均值 标准差 SR (%) T (s) f12 MFO 3.82 × 101 2.80 × 10² 1.19 × 10² 0 1.19 SCA 9.68 × 100 5.36 × 101 4.38 × 101 0 1.12 PSO 8.91 × 101 1.17 × 10² 1.36 × 101 0 0.79 f13 MSNSSA 4.78 × 10⁻³³ 4.97 × 10⁻²⁹ 9.06 × 10⁻²⁹ 100 4.34 SSSA 3.01 × 10⁻² 5.40 × 10⁻² 1.13 × 10⁻² 0 5.63 NSSA 4.83 × 10⁻²⁸ 3.29 × 10⁻¹⁶ 5.56 × 10⁻¹⁶ 100 4.00 SSA 3.04 × 101 4.57 × 101 9.46 × 100 0 3.61 BOA 9.80 × 10⁻¹ 1.11 × 100 5.44 × 10⁻² 0 6.74 MFO 7.21 × 10⁸ 1.31 × 10⁹ 2.86 × 10⁸ 0 4.38 SCA 3.71 × 10⁸ 1.01 × 10⁹ 3.02 × 10⁸ 0 4.24 PSO 3.75 × 100 5.75 × 100 1.01 × 100 0 3.30 f14 MSNSSA 1.35 × 10⁻³² 3.61 × 10⁻²⁷ 7.51 × 10⁻²⁷ 100 2.88 SSSA 5.36 × 100 9.72 × 100 8.22 × 10⁻¹ 0 3.61 NSSA 2.50 × 10⁻²⁶ 1.18 × 10⁻¹⁴ 4.32 × 10⁻¹⁴ 100 2.56 SSA 1.34 × 10² 1.76 × 10² 2.38 × 101 0 2.22 BOA 9.98 × 100 9.99 × 100 4.50 × 10⁻³ 0 4.21 MFO 8.43 × 10⁶ 2.38 × 10⁸ 1.98 × 10⁸ 0 2.51 SCA 8.61 × 10⁷ 3.31 × 10⁸ 1.46 × 10⁸ 0 2.49 PSO 1.07 × 10² 1.46 × 10² 2.28 × 101 0 1.99
下载: 导出CSV
表 5 基准函数Wilcoxon 秩和检验的p值
Table 5 p-value for Wilcoxon's rank-sum test on benchmark function
函数 SSSA NSSA SSA BOA MFO SCA PSO f1 7.05 × 10⁻¹⁸ + 7.05 × 10⁻¹⁸ + 7.05 × 10⁻¹⁸ + 7.05 × 10⁻¹⁸ + 3.92 × 10⁻⁵ + 1.16 × 10⁻¹³ + 7.05 × 10⁻¹⁸ + f2 7.07 × 10⁻¹⁸ + 7.07 × 10⁻¹⁸ + 7.07 × 10⁻¹⁸ + 7.07 × 10⁻¹⁸ + 7.07 × 10⁻¹⁸ + 7.07 × 10⁻¹⁸ + 7.07 × 10⁻¹⁸ + f3 7.07 × 10⁻¹⁸ + 7.07 × 10⁻¹⁸ + 7.07 × 10⁻¹⁸ + 7.07 × 10⁻¹⁸ + 7.07 × 10⁻¹⁸ + 7.07 × 10⁻¹⁸ + 7.07 × 10⁻¹⁸ + f4 7.07 × 10⁻¹⁸ + 7.07 × 10⁻¹⁸ + 7.07 × 10⁻¹⁸ + 7.07 × 10⁻¹⁸ + 7.07 × 10⁻¹⁸ + 7.07 × 10⁻¹⁸ + 7.07 × 10⁻¹⁸ + f5 4.26 × 10⁻¹⁸ + 4.26 × 10⁻¹⁸ + 4.26 × 10⁻¹⁸ + 4.26 × 10⁻¹⁸ + 4.26 × 10⁻¹⁸ + 4.26 × 10⁻¹⁸ + 4.26 × 10⁻¹⁸ + f6 6.79 × 10⁻¹⁸ + 6.79 × 10⁻¹⁸ + 6.79 × 10⁻¹⁸ + 6.79 × 10⁻¹⁸ + 6.79 × 10⁻¹⁸ + 6.79 × 10⁻¹⁸ + 6.79 × 10⁻¹⁸ + f7 1.26 × 10⁻¹⁹ + 5.96 × 10⁻¹⁸ + 3.23 × 10⁻²⁰ + 3.31 × 10⁻²⁰ + 2.61 × 10⁻¹⁷ + 8.22 × 10⁻² − 3.31 × 10⁻²⁰ + f8 3.51 × 10⁻¹⁸ + 4.12 × 10⁻¹⁹ + 1.25 × 10⁻²⁰ + 1.23 × 10⁻¹⁹ + 1.86 × 10⁻⁶ + 1.23 × 10⁻¹⁹ + 1.23 × 10⁻¹⁹ + f9 4.28 × 10⁻¹¹ + 9.53 × 10⁻¹⁷ + 7.07 × 10⁻¹⁸ + 7.07 × 10⁻¹⁸ + 7.06 × 10⁻¹⁸ + 7.07 × 10⁻¹⁸ + 7.07 × 10⁻¹⁸ + f10 4.67 × 10⁻¹⁹ + 1.14 × 10⁻¹² + 3.31 × 10⁻²⁰ + 1.69 × 10⁻¹⁸ + 3.30 × 10⁻²⁰ + 1.82 × 10⁻³ + 3.31 × 10⁻²⁰ + f11 5.90 × 10⁻¹⁸ + 6.96 × 10⁻¹⁷ + 5.90 × 10⁻¹⁸ + 5.90 × 10⁻¹⁸ + 5.90 × 10⁻¹⁸ + 5.90 × 10⁻¹⁸ + 5.90 × 10⁻¹⁸ + f12 3.31 × 10⁻²⁰ + 1.84 × 10⁻¹⁰ + 3.31 × 10⁻²⁰ + 3.29 × 10⁻²⁰ + 3.31 × 10⁻²⁰ + 3.31 × 10⁻²⁰ + 3.31 × 10⁻²⁰ + f13 7.04 × 10⁻¹⁸ + 7.48 × 10⁻¹⁸ + 7.04 × 10⁻¹⁸ + 7.04 × 10⁻¹⁸ + 7.04 × 10⁻¹⁸ + 7.04 × 10⁻¹⁸ + 7.04 × 10⁻¹⁸ + f14 7.05 × 10⁻¹⁸ + 7.05 × 10⁻¹⁸ + 7.05 × 10⁻¹⁸ + 7.05 × 10⁻¹⁸ + 7.05 × 10⁻¹⁸ + 7.05 × 10⁻¹⁸ + 7.05 × 10⁻¹⁸ + + / = / − 12 / 0 / 0 12 / 0 / 0 12 / 0 / 0 12 / 0 / 0 12 / 0 / 0 11 / 0 / 1 12 / 0 / 0
下载: 导出CSV
表 6 MAE算法排名
Table 6 MAE algorithm ranking
算法 MAE 排名 MSNSSA 7.12641 × 10⁻² 1 NSSA 7.12655 × 10⁻² 2 SSSA 7.67841 × 100 3 BOA 1.11882 × 101 4 PSO 6.98046 × 101 5 SSA 3.06178 × 10² 6 SCA 3.42235 × 10⁷ 7 MFO 5.23029 × 10⁷ 8
下载: 导出CSV
表 7 CEC 2014基准函数
Table 7 CEC 2014 benchmark function
函数 维度 特征 定义域 最佳值 CEC03 30 UN [−100, 100] 300 CEC05 30 MN [−100, 100] 500 CEC18 30 HF [−100, 100] 1800 CEC23 30 CF [−100, 100] 2300 CEC24 30 CF [−100, 100] 2400 CEC25 30 CF [−100, 100] 2500
下载: 导出CSV
表 8 CEC 2014优化结果对比
Table 8 Comparison of optimization results of CEC 2014
函数 指标 MSNSSA SSA BOA MFO SCA PSO CEC03 平均值 3.48173 × 10⁴ 7.13409 × 10⁴ 7.71258 × 10⁴ 1.05168 × 10⁵ 5.95030 × 10⁴ 4.93113 × 10⁴ 标准差 3.98187 × 10³ 1.97053 × 10⁴ 7.95590 × 10³ 4.35140 × 10⁴ 1.31496 × 10⁴ 7.30314 × 10³ CEC05 平均值 5.20018 × 10² 5.20177 × 10² 5.21049 × 10² 5.20275 × 10² 5.21035 × 10² 5.20990 × 10² 标准差 6.58164 × 10⁻³ 1.35252 × 10⁻¹ 6.03943 × 10⁻² 1.73345 × 10⁻¹ 4.83807 × 10⁻² 9.88705 × 10⁻² CEC18 平均值 2.78893 × 10³ 1.21041 × 10⁴ 4.31418 × 10⁹ 2.18893 × 10⁷ 3.16304 × 10⁸ 5.78922 × 10³ 标准差 7.12803 × 10² 9.17792 × 10³ 2.03175 × 10⁹ 8.30950 × 10⁷ 1.92087 × 10⁸ 3.37197 × 10³ CEC23 平均值 2.50000 × 10³ 2.63108 × 10³ 2.50000 × 10³ 2.67493 × 10³ 2.71333 × 10³ 2.61612 × 10³ 标准差 0 7.36331 × 100 0 4.24126 × 101 2.39342 × 101 1.24951 × 100 CEC24 平均值 2.70000 × 10³ 2.71750 × 10³ 2.70000 × 10³ 2.71882 × 10³ 2.73876 × 10³ 2.72053 × 10³ 标准差 0 5.83456 × 100 0 8.00616 × 100 7.90888 × 100 6.35266 × 100 CEC25 平均值 2.60000 × 10³ 2.64087 × 10³ 2.60000 × 10³ 2.68247 × 10³ 2.61048 × 10³ 2.63564 × 10³ 标准差 0 7.27821 × 100 0 3.48329 × 101 1.81045 × 101 1.02263 × 101
下载: 导出CSV
表 9 与参考文献中算法均值的对比
Table 9 Comparison of the mean with algorithm in references
算法 f1 f2 f3 f4 f5 f6 f7 MSNSSA 7.35 × 10−36 9.69 × 10⁻³² 1.47×10⁻²¹ 3.53 × 10⁻⁶ 0 0 0 MFOA-SQP[18] 0 5.62 × 10⁻¹¹ 5.96 × 10⁻⁶ 5.71 × 10⁻³ 2.88 × 101 2.53 × 10⁻⁴ 0 CSO[19] 0 1.79 × 10⁻⁹ 1.63 × 10⁻⁵ 6.15 × 10⁻⁴ 1.65 × 10² 6.06 × 10⁻³ 0 HCPSO[20] 8.71 × 10⁻²⁸ 3.39 × 10⁻³ 1.38 × 10⁻² 2.57 × 10⁻⁴ 3.14×10⁻⁵ 5.76 × 10⁻³ 3.68 × 10⁻¹⁰ DMS-PSO[21] 4.29 × 10⁻¹² 4.54 × 10⁻⁶ 2.06 × 101 1.07 × 10⁻² 2.77 × 101 5.68 × 10⁻² 7.31 × 10⁻⁴ PSO-SMS[11] 3.55 × 10⁻²⁰ 9.82 × 10⁻⁸ 1.53 × 10⁻⁵ 2.09 × 10⁻² 2.59 × 101 3.54 × 10⁻⁴ 7.19 × 10⁻³ CASSA[22] 9.35 × 10−147 2.84×10−52 8.66 × 10⁻⁶ 1.88 × 10⁻⁵ 2.77 × 101 9.81 × 10⁻² 0 CESSA[23] 2.50 × 10⁻²³ 4.22 × 10⁻³ 1.73 × 10⁻¹⁵ 5.90 × 10⁻⁵ 2.86 × 101 7.51 × 10⁻² 0 EHO[5] 9.63 × 10⁻⁷ 4.71 × 10⁻⁴ 6.93 × 10⁻¹ 1.25 × 10⁻⁵ 2.85 × 101 6.55 × 100 6.30 × 10⁻⁵ EWA[6] 7.25 × 101 2.15 × 100 2.48 × 10⁻⁵ 1.10 × 10⁻¹ 5.14 × 10³ 2.74 × 10³ 9.93 × 10⁻³ MBO[7] 8.53 × 10⁻³ 4.17 × 10⁻⁴ 2.66 × 10⁻¹ 4.46 × 10⁻¹ 2.05 × 10⁻⁷ 1.42 × 100 1.52 × 10⁻² MABC[24] 6.02 × 10⁻⁴ 6.53 × 10⁻⁶ 9.55 × 100 1.07 × 10⁻² 2.25 × 10⁻⁸ 5.98 × 100 2.91 × 10⁻¹ MIWO[25] 3.17 × 10⁻⁵ 5.41 × 10⁻¹⁰ 9.34 × 10⁻¹³ 8.41 × 10⁻³ 5.28 × 10⁻¹ 7.68 × 10⁻² 4.50 × 10⁻¹ MPEA[26] 2.70 × 10⁻¹¹ 1.52 × 10⁻²⁰ 1.04 × 10⁻² 2.35 × 10⁻¹ 6.74 × 10⁻¹² 3.26 × 10⁻⁵ 8.74 × 10⁻³ 算法 f8 f9 f10 f11 f12 f13 f14 MSNSSA 9.98 × 10⁻¹ 3.08 × 10⁻⁴ 0 8.88 × 10⁻¹⁶ 0 1.39 × 10⁻³⁴ 3.27 × 10⁻³⁰ MFOA-SQP[18] 9.98 × 10⁻¹ 1.06 × 10⁻³ 0 3.55 × 10⁻¹⁵ 0 3.71 × 10⁻⁶ 7.53 × 10⁻¹⁰ CSO[19] 9.98 × 10⁻¹ 6.03 × 10⁻⁴ 1.12 × 10⁻⁷ 1.24 × 10⁻¹² 0 1.64 × 10⁻⁷ 2.24 × 10⁻¹ HCPSO[20] 9.98 × 10⁻¹ 1.40 × 10⁻² 2.49 × 10⁻⁵ 2.26 × 10⁻⁴ 8.67 × 10⁻⁵ 2.69 × 10⁻¹³ 4.18 × 10⁻³ DMS-PSO[21] 2.13 × 100 5.68 × 10⁻¹ 3.88 × 101 1.88 × 100 2.24 × 10⁻² 2.87 × 10⁻³ 6.88 × 10⁻¹ PSO-SMS[11] 9.98 × 10⁻¹ 2.09 × 10⁻² 1.53 × 101 2.99 × 100 7.23 × 10⁻² 1.12 × 10⁻⁵ 1.76 × 10⁻⁸ CASSA[22] 9.98 × 10⁻¹ 4.81 × 10⁻³ 0 8.88 × 10⁻¹⁶ 0 2.33 × 10⁻²⁰ 1.68 × 10⁻² CESSA[23] 9.98 × 10⁻¹ 2.59 × 10⁻³ 1.48 × 101 1.06 × 10⁻² 2.88 × 10⁻¹ 5.68 × 10⁻¹⁸ 2.62 × 101 EHO[5] 1.67 × 100 1.27 × 10⁻¹ 1.21 × 10⁻⁶ 2.39 × 10⁻⁴ 1.89 × 10⁻⁶ 1.35 × 10⁻¹ 6.86 × 101 EWA[6] 1.50 × 100 1.76 × 10⁻³ 3.10 × 101 3.05 × 100 1.53 × 100 5.77×10⁻¹ 1.35 × 10⁻³ MBO[7] 9.98 × 10⁻¹ 1.78 × 10⁻¹ 5.86 × 10⁻¹ 1.13 × 10⁻¹ 8.05 × 10⁻¹ 7.20 × 10⁻¹⁵ 7.12 × 10⁻¹ MABC[24] 1.41 × 100 4.32 × 10⁻⁴ 4.15 × 10⁻² 2.05 × 10⁻¹ 5.63 × 10⁻² 8.05 × 10⁻⁹ 1.18 × 10⁻² MIWO[25] 1.89 × 100 1.01 × 10⁻² 4.62 × 10⁻¹ 1.86 × 10⁻¹ 3.29 × 10⁻² 1.98 × 10⁻¹ 1.35 × 10⁻³ MPEA[26] 9.98 × 10⁻¹ 1.46 × 10⁻³ 6.38 × 10⁻⁶ 2.84 × 10⁻¹ 4.38 × 10⁻⁷ 2.01×10⁻⁶ 2.27 × 10⁻⁵
下载: 导出CSV
表 10 与参考文献中算法标准差的对比
Table 10 Comparison of the standard deviation with algorithms in reference
算法 f1 f2 f3 f4 f5 f6 f7 MSNSSA 1.04 × 10⁻³⁵ 4.52 × 10⁻³² 4.75×10⁻²¹ 1.75 × 10⁻⁶ 0 0 0 MFOA-SQP[18] 0 2.20 × 10⁻¹¹ 2.03 × 10⁻⁶ 4.12 × 10⁻³ 5.10 × 10⁻² 2.17 × 10⁻⁴ 0 CSO[19] 0 1.04 × 10⁻⁹ 4.73 × 10⁻⁶ 3.12 × 10⁻² 7.39 × 10² 4.75 × 10⁻³ 0 HCPSO[20] 3.55 × 10⁻²⁸ 2.04 × 10⁻³ 5.80 × 10⁻³ 1.88 × 10⁻⁵ 1.07 × 10⁻⁴ 3.48 × 10⁻³ 5.97 × 10⁻¹⁰ DMS-PSO[21] 3.00 × 10⁻¹¹ 2.23 × 10⁻⁵ 7.48 × 100 1.03 × 10⁻³ 2.69 × 100 4.87 × 10⁻² 3.81 × 10⁻¹ PSO-SMS[11] 4.61 × 10⁻²⁰ 1.47 × 10⁻⁷ 4.65 × 10⁻⁶ 2.50 × 10⁻³ 2.19 × 100 2.21 × 10⁻⁴ 1.57 × 10⁻⁴ CASSA[22] 2.32 × 10−147 2.27×10−50 4.15 × 10⁻⁶ 1.21 × 10⁻⁵ 1.16 × 10⁻¹ 4.08 × 10⁻² 0 CESSA[23] 1.84 × 10⁻²³ 1.51 × 10 −2 1.25 × 10⁻¹³ 5.08 × 10⁻⁵ 4.89 × 10⁻² 3.11 × 10⁻² 0 EHO[5] 1.26 × 10⁻⁷ 8.23 × 10⁻⁴ 8.44 × 10⁻¹ 1.26 × 10⁻⁵ 1.83 × 10⁻² 7.56 × 100 6.21 × 10⁻⁵ EWA[6] 7.43 × 101 1.54 × 100 7.37 × 10⁻⁶ 8.73 × 10⁻² 8.93 × 10³ 2.58 × 10⁻³ 1.93 × 10⁻⁴ MBO[7] 1.28 × 10⁻⁴ 1.83 × 10⁻⁴ 3.00 × 100 3.89 × 10⁻¹ 3.54 × 10⁻⁷ 3.65 × 10⁻¹ 1.10 × 10⁻² MABC[24] 7.23 × 10⁻³ 3.63 × 10⁻³ 1.18 × 100 1.77 × 10⁻¹ 3.87 × 10⁻⁷ 1.21 × 10⁻¹ 1.55 × 10⁻¹ MIWO[25] 4.32 × 10⁻⁶ 1.28 × 10⁻⁵ 2.21 × 10⁻¹² 2.63 × 10⁻³ 7.54 × 10⁻¹ 1.82 × 10⁻² 2.09 × 10⁻² MPEA[26] 5.74 × 10⁻¹⁰ 4.13 × 10⁻¹⁸ 1.80 × 10⁻¹ 5.22 × 10⁻² 3.19 × 10⁻¹⁰ 2.63−6 3.56 × 10⁻¹ 算法 f8 f9 f10 f11 f12 f13 f14 MSNSSA 2.95 × 10⁻²³ 3.56 × 10⁻⁸ 0 0 0 3.56 × 10⁻³⁴ 7.31 × 10⁻³⁰ MFOA-SQP[18] 1.13 × 10⁻¹ 4.47 × 10⁻⁴ 0 1.32 × 10⁻¹² 0 1.76 × 10⁻⁶ 5.56 × 10⁻¹⁰ CSO[19] 8.01 × 100 9.92 × 10⁻⁴ 3.16 × 10⁻⁵ 1.01 × 10⁻¹¹ 0 4.74 × 10⁻⁷ 1.17 × 10⁻¹ HCPSO[20] 2.96 × 100 6.22 × 10⁻² 1.05 × 10⁻⁵ 2.52 × 10⁻⁴ 2.79 × 10⁻⁶ 5.95 × 10⁻¹¹ 1.84 × 10⁻⁵ DMS-PSO[21] 5.94 × 10⁻¹ 8.04 × 10⁻¹ 2.80 × 100 2.46 × 10⁻¹ 1.77 × 10⁻² 7.54 × 10⁻¹ 5.02 × 10⁻¹ PSO-SMS[11] 2.77 × 10⁻¹ 5.76 × 10⁻³ 1.29 × 100 3.87 × 10⁻¹ 6.36 × 10⁻² 3.35 × 10⁻⁶ 9.20 × 10⁻⁹ CASSA[22] 2.82 × 10⁻¹ 2.56 × 10⁻⁵ 0 9.86 × 10⁻³² 0 8.12 × 10⁻¹⁸ 1.35 × 10⁻² CESSA[23] 9.19×101 8.90 × 10⁻¹ 2.15 × 101 5.31 × 10⁻² 3.41 × 10⁻¹ 1.08 × 10⁻¹⁸ 6.14 × 100 EHO[5] 8.37 × 10⁻¹ 1.62 × 100 2.30 × 10⁻⁷ 1.37 × 10⁻⁵ 3.17 × 10⁻⁷ 2.20 × 100 3.37 × 101 EWA[6] 2.28 × 10⁻¹ 4.22 × 10⁻² 1.87 × 101 1.24 × 100 4.99 × 10⁻¹ 3.22 × 10⁻¹ 2.04 × 10⁻³ MBO[7] 3.95 × 100 4.65 × 100 4.17 × 10⁻¹ 7.19 × 100 8.32 × 10⁻¹ 1.27 × 10⁻¹² 2.27 × 10⁻¹ MABC[24] 6.58 × 100 8.28 × 10⁻¹ 2.41 × 10⁻¹ 1.65 × 10⁻¹ 5.66 × 10⁻¹ 6.77 × 10⁻¹ 1.67 × 10⁻¹ MIWO[25] 1.92 × 101 2.07 × 10⁻² 1.30 × 10⁻¹ 2.68 × 100 5.31 × 10⁻¹ 2.30 × 10⁻¹ 1.42 × 10⁻² MPEA[26] 5.37 × 10⁻¹ 7.43 × 10⁻³ 5.35 × 10⁻⁶ 3.91 × 10⁻¹ 7.48 × 10⁻³ 5.94 × 10⁻⁸ 6.36 × 10⁻⁴
下载: 导出CSV
-
[1] Kennedy J, Eberhart R. Particle swarm optimization. In: Proceedings of the International Conference on Neural Networks. Perth, Australia: IEEE, 1995. 1942−1948 [2] Mirjalili S. SCA: a sine cosine algorithm for solving optimization problems. Knowledge Based Systems, 2016, 96(96): 120-133. [3] Arora S, Singh S. Butterfly optimization algorithm: a novel approach for global optimization. Soft Computing, 2019, 23(3): 715-734. doi: 10.1007/s00500-018-3102-4 [4] Mirjalili S. Moth-flame optimization algorithm: a novel nature-inspired heuristic paradigm. Knowledge-Based Systems, 2015, 89(11): 228-249. [5] Wang Gai-Ge, Deb S, Cui Zhi-Hua. Monarch butterfly optimization. Neural Computing and Applications, 2019, 31(7): 1-20. [6] Wang Gai-Ge, Suash D, Santos C L D. Earthworm optimization algorithm: a bio-inspired metaheuristic algorithm for global optimization problems. International Journal of Bio-Inspired Computation, 2018, 12(1): 1-22. doi: 10.1504/IJBIC.2018.093328 [7] Wang G G, Deb S, Coelho L D S. Elephant herding optimization. In: Proceedings of the International Symposium on Computational and Business Intelligence. Bali, Indonesia: IEEE, 2015. 1−5 [8] Mirjalili S, Gandomi A H, Mirjalili S Z, Saremi S, Faris H, Mirjalili S M. Salp swarm algorithm: a bio-inspired optimizer for engineering design problems. Advances in Engineering Software, 2017, 114(6): 163-191. [9] Hegazy A E, Makhlouf M A, Eltawel G S. Improved salp swarm algorithm for feature selection. Journal of King Saud University–Computer and Information Sciences, 2018, 6(3): 1-10. [10] Sayed G I, Khoriba G, Haggag M H. A novel chaotic salp swarm algorithm for global optimization and feature selection. Applied Intelligence, 2018, 48(3): 1-20. [11] 曾辉, 王倩, 夏学文, 方霞. 基于自适应多种群的粒子群优化算法. 计算机工程与应用, 2018, 54(10): 59-65. doi: 10.3778/j.issn.1002-8331.1711-0048Zeng Hui, Wang Qian, Xia Xue-Wen, Fang Xia. Particle swarm optimization algorithm based on self-adaptive multi-swarm. Computer Engineering and Applications, 2018, 54(10): 59-65. doi: 10.3778/j.issn.1002-8331.1711-0048 [12] 辛梓芸, 张达敏, 陈忠云, 张绘娟, 闫威. 多段扰动的共享型乌鸦算法. 计算机工程与应用, 2020, 56(02): 55-61.Xin Zi-Yun, Zhang Da-Min, Chen Zhong-Yun, Zhang Hui-Juan, Yan Wei. Shared crow algorithm using multi-segment perturbation. Computer Engineering and Applications, 2020, 56(02): 55-61. [13] Zhao Xin-Chao, Gao Xiao-Shan, Hu Ze-Chun. Evolutionary programming based on non-uniform mutation. Applied Mathematics and Computation, 2007, 192(1): 1-11. doi: 10.1016/j.amc.2006.06.107 [14] He Xing-Shi, Ding Wen-Jing, Yang Xin-She. Bat algorithm based on simulated annealing and Gaussian perturbations. Neural Computing and Applications, 2014, 25(2): 459-468. doi: 10.1007/s00521-013-1518-4 [15] Mirjalili S, Mirjalili S M, Yang Xin-She. Binary bat algorithm. Neural Computing and Applications, 2014, 25(3): 663-681. [16] Derrac J, Garcia S, Molina D, Herrera F. A practical tutorial on the use of nonparametric statistical tests as a methodology for comparing evolutionary and swarm intelligence algorithms. Swarm & Evolutionary Computation, 2011, 1(1): 3-18. [17] Emad N. A modified flower pollination algorithm for global optimization. Expert Systems with Applications, 2016, 57(9): 192-203. [18] 王英博, 王艺星. 基于SQP局部搜索的多子群果蝇优化算法. 计算机工程与科学, 2018, 40(05): 906-915. doi: 10.3969/j.issn.1007-130X.2018.05.020Wang Ying-Bo, Wang Yi-Xing. A multiple subgroups fruit fly optimization algorithm based on sequential quadratic programming local search. Computer Engineering & Science, 2018, 40(05): 906-915. doi: 10.3969/j.issn.1007-130X.2018.05.020 [19] Meng X B, Liu Y, Gao X Z, Zhang H Z. A new bio-inspired algorithm: Chicken swarm optimization. In: Proceedings of the International Conference in Swarm Intelligence. Hefei, China: Springer, 2014. 86−94 [20] 袁小平, 蒋硕. 基于分层自主学习的改进粒子群优化算法. 计算机应用, 2019, 39(01): 148-153.Yuan Xiao-Ping, Jiang Shuo. Improved particle swarm optimization algorithm based on hierarchical autonomous learning. Journal of Computer Applications, 2019, 39(01): 148-153. [21] Liang J J, Suganthan P N. Dynamic multi-swarm particle swarm optimizer. In: Proceedings of the Swarm Intelligence Symposium. Pasadena, USA: IEEE, 2005. 124−129 [22] 张达敏, 陈忠云, 辛梓芸, 张绘娟, 闫威. 基于疯狂自适应的樽海鞘群算法. 控制与策, 2020, 35(09):2112-2120Zhang Da-Min, Chen Zhong-Yun, Xin Zi-Yun, Zhang Hui-Juan, Yan Wei. Salp swarm algorithm based on craziness and adaptive. Controland Decision, 2020, 35(09): 2112-2120 [23] 陈忠云, 张达敏, 辛梓芸, 张绘娟, 闫威. 混沌精英质心拉伸机制的樽海鞘群算法. 计算机工程与应用, 2020, 56(10): 44-50Chen Zhong-Yun, Zhang Da-Min, Xin Zi-Yun, Zhang Hui-Juan,Yan Wei. Salp swarm algorithm using chaotic and elite centroidstretching mechanism. Computer Engineering and Applications,2020,56(10):44-50 [24] Zhang Li-Ming, Wang Sai-Sai, Zhang Kai, et al. Cooperative artificial bee colony algorithm with multiple populations for interval multiobjective optimization problems. IEEE Transactions on Fuzzy Systems, 2019, 27(5): 1052-1065. doi: 10.1109/TFUZZ.2018.2872125 [25] Naidu Y R, Ojha A K. Solving multiobjective optimization problems using hybrid cooperative invasive weed optimization with multiple populations. Systems man and Cybernetics, 2018, 48(6): 821-832. [26] Liu Hai-Tao, Du Wei, Guo Zhao-Xia. A multi-population evolutionary algorithm with single-objective guide for many-objective. Optimization. Information Sciences, 2019, 503(09): 39-60. -


计量
- 文章访问数: 560
- HTML全文浏览量: 261
- PDF下载量: 142
- 被引次数: 0
