

-
摘要: 极化合成孔径雷达(Polarimetric synthetic aperture radar,PolSAR)是一种多参数、多通道的微波成像系统,在农林业、地质、海洋和军事等领域有着广泛的应用前景.PolSAR图像的相干斑抑制和分类是数据解译的重要环节,已经成为遥感领域的研究热点.本文综述了现有PolSAR图像的相干斑噪声抑制和分类方法并进行展望.首先,简要介绍了PolSAR系统的主要进展和应用;然后,对PolSAR图像相干斑抑制的评价指标和方法进行综述并对几种代表性方法进行了实验对比;接下来,对PolSAR图像的特征进行分析归纳,分别对有监督、无监督和半监督的PolSAR分类方法进行总结并给出了几种有监督分类方法的实验比较;最后,对PolSAR图像相干斑抑制和分类方法未来可能的研究方向进行了思考和讨论.Abstract: Polarimetric synthetic aperture radar (PolSAR) is a multi-parameter multi-channel microwave imaging system and it has wide applications in many fields such as agroforestry, geology, oceanography and military. Speckle reduction and classification are important steps in the PolSAR image interpretation process and the related techniques have become a hot research topic in remote sensing. This paper reviews the existing PolSAR image speckle reduction and classification methods. Firstly, the main progresses and applications of PolSAR systems are briefly described. Then, the speckle reduction methods for PolSAR image are summarized and comparative experiments are conducted on several representative despeckling methods. Next, the features for PloSAR classification are discussed and the algorithms for supervised, unsupervised and semi-supervised classification are reviewed. Besides, the experiments on several supervised classification methods are given. Finally, the potential further research directions of the PolSAR image speckle reduction and classification methods are discussed.1) 本文责任编委 谢永芳
-
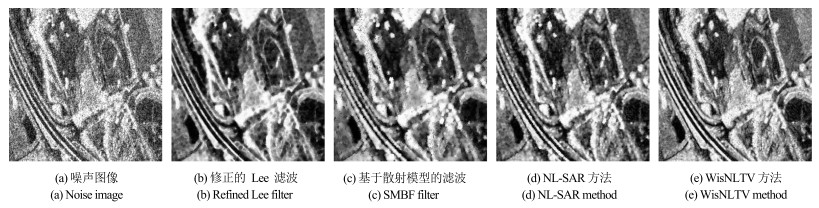
图 1 不同PolSAR数据相干斑抑制方法的视觉对比结果
Fig. 1 Visual comparison results of different PolSAR data speckle reduction methods
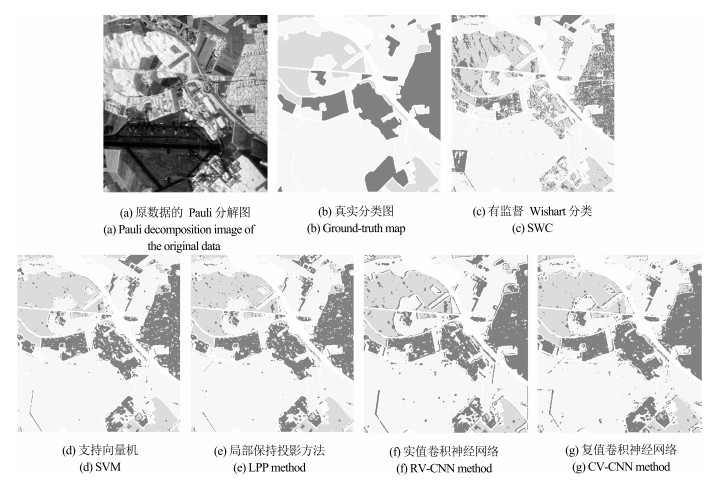
图 3 不同PolSAR图像分类方法的对比结果
Fig. 3 Comparison results of different PolSAR image classification methods
表 1 各类PolSAR数据相干斑抑制方法比较表
Table 1 Comparison of different types of PolSAR data speckle reduction methods
相干斑抑制方法 代表性算法 优点 不足 空域滤波方法 修正的Lee、IDAN、改进的sigma滤波 操作简单、计算速度快 空间分辨率低、边缘模糊、细节信息丢失 非局部均值方法 Pretest、随机散度滤波、NL-SAR 去噪效果显著、结构特征保持得好 计算速度很慢、出现像素块状效应 变分方法 WisTV、WisNLTV、MuLoG算法 去噪显著、速度快、边缘保持得好 弱目标丢失、平坦区域出现阶梯效应  下载: 导出CSV
表 2 不同PolSAR数据相干斑抑制方法的量化比较表
Table 2 Quantitative comparison of different PolSAR data speckle reduction methods
指标/方法 修正的Lee滤波 SMBF滤波 NL-SAR方法 WisNLTV方法 ENL 13.8698 10.9144 11.5435 10.7267 EPD-ROA水平方向 0.6863 0.7356 0.7505 0.7533 EPD-ROA垂直方向 0.7472 0.7957 0.8046 0.8109
下载: 导出CSV
表 3 不同PolSAR图像分类方法的分类精度比较(%)
Table 3 Classification accuracy of different PolSAR image classification methods (%)
类别/方法 SWC SVM LPP RV-CNN CV-CNN 城市区域 49.4 78.7 82.5 85.7 91.3 林地区域 80.2 93.8 93.8 85.2 92.2 其他区域 95.6 95.9 96.5 93.4 94.6 总精度 81.2 91.2 92.5 89.9 93.4
下载: 导出CSV
-
[1] Oliver C, Quegan S. Understanding Synthetic Aperture Radar Images. Raleigh, NC, USA: SciTech Publishing, 2004. [2] Lee J, Pottier E. Polarimetric Radar Imaging: From Basics to Applications. Florida, USA: CRC Press, 2009. [3] 周晓光, 匡纲要, 万建伟.极化SAR图像分类综述.信号处理, 2008, 24(5): 806-812 doi: 10.3969/j.issn.1003-0530.2008.05.023Zhou Xiao-Guang, Kuang Gang-Yao, Wan Jian-Wei. A review of polarimetric SAR image classification. Signal Processing, 2008, 24(5): 806-812 doi: 10.3969/j.issn.1003-0530.2008.05.023 [4] Goodman J W. Some fundamental properties of speckle. Journal of the Optical Society of America, 1976, 66(11): 1145-1150 doi: 10.1364/JOSA.66.001145 [5] Touzi R, Lopes A. The principle of speckle filtering in polarimetric SAR imagery. IEEE Transactions on Geoscience and Remote Sensing, 1994, 32(5): 1110-1114 doi: 10.1109/36.312901 [6] Lopez-Martinez C, Fabregas X. Polarimetric SAR speckle noise model. IEEE Transactions on Geoscience and Remote Sensing, 2003, 41(10): 2232-2242 doi: 10.1109/TGRS.2003.815240 [7] Lee J S, Grunes M R, De Grandi G. Polarimetric SAR speckle filtering and its implication for classification. IEEE Transactions on Geoscience and Remote Sensing, 1999, 37(5): 2363-2373 doi: 10.1109/36.789635 [8] Lopez-Martinez C, Fabregas X. Model-based polarimetric SAR speckle filter. IEEE Transactions on Geoscience and Remote Sensing, 2008, 46(11): 3894-3907 doi: 10.1109/TGRS.2008.2002029 [9] Foucher S, López-Martínez C. Analysis, evaluation, and comparison of polarimetric SAR speckle filtering techniques. IEEE Transactions on Image Processing, 2014, 23(4): 1751-1764 doi: 10.1109/TIP.2014.2307437 [10] van Zyl J J, Zebker H A, Elachi C. Imaging radar polarization signatures: theory and observation. Radio Science, 1987, 22(4): 529-543 doi: 10.1029/RS022i004p00529 [11] Xie H, Pierce L E, Ulaby F T. SAR speckle reduction using wavelet denoising and Markov random field modeling. IEEE Transactions on Geoscience and Remote Sensing, 2002, 40(10): 2196-2212 doi: 10.1109/TGRS.2002.802473 [12] Feng H X, Hou B, Gong M G. SAR image despeckling based on local homogeneous-region segmentation by using pixel-relativity measurement. IEEE Transactions on Geoscience and Remote Sensing, 2011, 49(7): 2724-2737 doi: 10.1109/TGRS.2011.2107915 [13] 周晓光, 匡纲要, 万建伟.多极化SAR图像斑点抑制综述.中国图象图形学报, 2008, 13(3): 377-385 http://d.old.wanfangdata.com.cn/Periodical/zgtxtxxb-a200803001Zhou Xiao-Guang, Kuang Gang-Yao, Wan Jian-Wei. A review of polarimetric SAR speckle reduction. Journal of Image and Graphics, 2008, 13(3): 377-385 http://d.old.wanfangdata.com.cn/Periodical/zgtxtxxb-a200803001 [14] Gonzalez R C, Woods R E. Digital Image Processing (3rd edition). Upper Saddle River, NJ: Prentice-Hall, 2012. [15] Lee J S, Grunes M R, Schuler D L, Pottier E, Ferro-Famil L. Scattering-model-based speckle filtering of polarimetric SAR data. IEEE Transactions on Geoscience and Remote Sensing, 2006, 44(1): 176-187 doi: 10.1109/TGRS.2005.859338 [16] Vasile G, Trouve E, Lee J S, Buzuloiu V. Intensity-driven adaptive-neighborhood technique for polarimetric and interferometric SAR parameters estimation. IEEE Transactions on Geoscience and Remote Sensing, 2006, 44(6): 1609-1621 doi: 10.1109/TGRS.2005.864142 [17] Deledalle C A, Denis L, Tupin F, Reigber A, Jäger M. NL-SAR: a unified nonlocal framework for resolution-preserving (Pol)(In)SAR denoising. IEEE Transactions on Geoscience and Remote Sensing, 2015, 53(4): 2021-2038 doi: 10.1109/TGRS.2014.2352555 [18] Ding Z G, Zeng T, Dong F, Liu L S, Yang W F, Long T. An improved PolSAR image speckle reduction algorithm based on structural judgment and hybrid four-component polarimetric decomposition. IEEE Transactions on Geo- science and Remote Sensing, 2013, 51(8): 4438-4449 doi: 10.1109/TGRS.2013.2270036 [19] D$'$Hondt O, Guillaso S, Hellwich O. Iterative bilateral filtering of polarimetric SAR data. IEEE Journal of Selected Topics in Applied Earth Observations and Remote Sensing, 2013, 6(3): 1628-1639 doi: 10.1109/JSTARS.2013.2256881 [20] Lang F K, Yang J, Li D R. Adaptive-window polarimetric SAR image speckle filtering based on a homogeneity measurement. IEEE Transactions on Geoscience and Remote Sensing, 2015, 53(10): 5435-5446 doi: 10.1109/TGRS.2015.2422737 [21] Lee J S, Ainsworth T L, Wang Y T, Chen K -S. Polarimetric SAR speckle filtering and the extended sigma filter. IEEE Transactions on Geoscience and Remote Sensing, 2015, 53(3): 1150-1160 doi: 10.1109/TGRS.2014.2335114 [22] Alonso-González A, López-Martínez C, Salembier P. PolSAR time series processing with binary partition trees. IEEE Transactions on Geoscience and Remote Sensing, 2014, 52(6): 3553-3567 doi: 10.1109/TGRS.2013.2273664 [23] Salehi M, Mohammadzadeh A, Maghsoudi Y. Adaptive speckle filtering for time series of polarimetric SAR images. IEEE Journal of Selected Topics in Applied Earth Observations and Remote Sensing, 2017, 10(6): 2841-2848 doi: 10.1109/JSTARS.2017.2698020 [24] Buades A, Coll B, Morel J M. A non-local algorithm for image denoising. In: Proceedings of the 2005 IEEE Computer Society Conference on Computer Vision and Pattern Recognition. San Diego, CA, USA: IEEE, 2005. 60-65 https://www.iro.umontreal.ca/~mignotte/IFT6150/Articles/Buades-NonLocal.pdf [25] Chen J, Chen Y L, An W T, Cui Y, Yang J. Nonlocal filtering for polarimetric SAR data: a pretest approach. IEEE Transactions on Geoscience and Remote Sensing, 2011, 49(5): 1744-1754 doi: 10.1109/TGRS.2010.2087763 [26] Zhong H, Zhang J J, Liu G C. Robust polarimetric SAR despeckling based on nonlocal means and distributed lee filter. IEEE Transactions on Geoscience and Remote Sensing, 2014, 52(7): 4198-4210 doi: 10.1109/TGRS.2013.2280278 [27] Torres L, Sant$'$Anna S J S, Da Costa Freitas C, Frery A C. Speckle reduction in polarimetric SAR imagery with stochastic distances and nonlocal means. Pattern Recognition, 2014, 47(1): 141-157 http://www.wanfangdata.com.cn/details/detail.do?_type=perio&id=b00fddd7cd8d22e065568b3eb6bd3c28 [28] Wang Y T, Ainsworth T L, Lee J S. Application of mixture regression for improved polarimetric SAR speckle filtering. IEEE Transactions on Geoscience and Remote Sensing, 2017, 55(1): 453-467 doi: 10.1109/TGRS.2016.2608501 [29] Ma X S, Wu P H, Shen H F. Multifrequency polarimetric SAR image despeckling by iterative nonlocal means based on a space-frequency information joint covariance matrix. IEEE Journal of Selected Topics in Applied Earth Observations and Remote Sensing, 2019, 12(1): 274-284 doi: 10.1109/JSTARS.2018.2884194 [30] Sharma R, Panigrahi R K. CFAR-based adaptive PolSAR speckle filter. IEEE Journal of Selected Topics in Applied Earth Observations and Remote Sensing, 2018, 11(12): 4895-4905 doi: 10.1109/JSTARS.2018.2877670 [31] Jordan C. Sur la série de Fourier. Comptes Rendus de l'Académie des Sciences Paris, 1881, 92(5): 228-230 http://d.old.wanfangdata.com.cn/NSTLQK/NSTL_QKJJ021418533/ [32] Rudin L I, Osher S, Fatemi E. Nonlinear total variation based noise removal algorithms. Physica D: Nonlinear Phenomena, 1992, 60(1-4): 259-268 doi: 10.1016/0167-2789(92)90242-F [33] Li H, Qin Z Y. PolSAR image speckle reduction algorithm based on TV-PDE. In: Proceedings of the SPIE 8002, MIPPR 2011: Multispectral Image Acquisition, Processing, and Analysis. Guilin, China: SPIE, 2011, 8002: Article No. 80020S http://adsabs.harvard.edu/abs/2011SPIE.8002E..0SL [34] Liu H Y, Yan F X, Zhu J B, Fang F M. Adaptive vectorial total variation models for multi-channel synthetic aperture radar images despeckling with fast algorithms. IET Image Processing, 2013, 7(9): 795-804 doi: 10.1049/iet-ipr.2013.0177 [35] Nie X L, Qiao H, Zhang B. A variational model for PolSAR data speckle reduction based on the Wishart distribution. IEEE Transactions on Image Processing, 2015, 24(4): 1209-1222 doi: 10.1109/TIP.2015.2396292 [36] Nie X L, Qiao H, Zhang B, Huang X Y. A nonlocal TV- based variational method for PolSAR data speckle reduction. IEEE Transactions on Image Processing, 2016, 25(6): 2620-2634 doi: 10.1109/TIP.2016.2552402 [37] Nie X L, Zhang B, Chen Y J, Qiao H. A new algorithm for optimizing TV-based PolSAR despeckling model. IEEE Signal Processing Letters, 2016, 23(10): 1409-1413 doi: 10.1109/LSP.2016.2602299 [38] Deledalle C -A, Denis L, Tabti S, Tupin F. MuLoG, or how to apply Gaussian denoisers to multi-channel SAR speckle reduction? IEEE Transactions on Image Processing, 2017, 26(9): 4389-4403 doi: 10.1109/TIP.2017.2713946 [39] Farage G, Foucher S, Benie G B. PolSAR image filtering based on feature detection using the wavelet transform. In: Proceedings of the 2007 IEEE International Geoscience and Remote Sensing Symposium IGARSS. Barcelona, Spain: IEEE, 2007, 2648-2652 https://www.researchgate.net/publication/224301188_PolSAR_image_filtering_based_on_feature_detection_using_the_wavelet_transform [40] Foucher S, Farage G, Bénié G B. Polarimetric SAR image filtering with trace-based partial differential equations. Canadian Journal of Remote Sensing, 2007, 33(3): 226- 236 http://www.wanfangdata.com.cn/details/detail.do?_type=perio&id=10.5589/m07-023 [41] Sun S, Tian J W, Liu Z S, Cai N. Anisotropic diffusion for speckle filtering of polarimetric synthetic aperture radar imagery. Journal of Electronic Imaging, 2013, 22(1): Article No. 013003003-013 https://www.researchgate.net/publication/236116496_Anisotropic_Diffusion_for_Speckle_Filtering_of_Polarimetric_Synthetic_Aperture_Radar_Imagery [42] Ma X S, Wu P H, Wu Y L, Shen H F. A review on recent developments in fully polarimetric SAR image despeckling. IEEE Journal of Selected Topics in Applied Earth Observations and Remote Sensing, 2018, 11(3): 743-758 doi: 10.1109/JSTARS.2017.2768059 [43] Tu S T, Chen J Y, Yang W, Sun H. Laplacian eigenmaps-based polarimetric dimensionality reduction for SAR image classification. IEEE Transactions on Geoscience and Remote Sensing, 2012, 50(1): 170-179 doi: 10.1109/TGRS.2011.2168532 [44] Huynen J R. Phenomenological Theory of Radar Targets[Ph. D. dissertation], Technical University of Delft, The Netherlands, 1970. https://repository.tudelft.nl/islandora/object/uuid:e4a140a0-c175-45a7-ad41-29b28361b426?collection=research [45] Yang J, Peng Y N, Yamaguchi Y, Yamada H. On Huynen$'$s decomposition of a Kennaugh matrix. IEEE Geoscience and Remote Sensing Letters, 2006, 3(3): 369- 372 doi: 10.1109/LGRS.2006.873229 [46] Freeman A, Durden S L. A three-component scattering model for polarimetric SAR data. IEEE Transactions on Geoscience and Remote Sensing, 1998, 36(3): 963-973 doi: 10.1109/36.673687 [47] Yamaguchi Y, Moriyama T, Ishido M, Yamada H. Four-component scattering model for polarimetric SAR image decomposition. IEEE Transactions on Geoscience and Remote Sensing, 2005, 43(8): 1699-1706 doi: 10.1109/TGRS.2005.852084 [48] Freeman A. Fitting a two-component scattering model to polarimetric SAR data from forests. IEEE Transactions on Geoscience and Remote Sensing, 2007, 45(8): 2583-2592 doi: 10.1109/TGRS.2007.897929 [49] Kusano S, Takahashi K, Sato M. A new decomposition of a PolSAR coherency matrix using a generalized scattering model. IEEE Journal of Selected Topics in Applied Earth Observations and Remote Sensing, 2015, 8(8): 3933-3940 doi: 10.1109/JSTARS.2014.2367540 [50] Cloude S R, Pottier E. A review of target decomposition theorems in radar polarimetry. IEEE Transactions on Geoscience and Remote Sensing, 1996, 34(2): 498-518 doi: 10.1109/36.485127 [51] van Zyl J J. Application of cloude$'$s target decomposition theorem to polarimetric imaging radar data. In: Proceedings of the SPIE — the International Society for Optical Engineering. San Diego, CA, USA: SPIE, 1993. 184-191 [52] Krogager E. New decomposition of the radar target scattering matrix. Electronics Letters, 1990, 26(18): 1525- 1527 doi: 10.1049/el:19900979 [53] Cameron W L, Rais H. Conservative polarimetric scatterers and their role in incorrect extensions of the Cameron decomposition. IEEE Transactions on Geoscience and Remote Sensing, 2006, 44(12): 3506-3516 doi: 10.1109/TGRS.2006.879115 [54] Touzi R. Target scattering decomposition in terms of roll-invariant target parameters. IEEE Transactions on Geoscience and Remote Sensing, 2007, 45(1): 73-84 doi: 10.1109/TGRS.2006.886176 [55] Goodman N R. Statistical analysis based on a certain multivariate complex Gaussian distribution (an introduction). The Annals of Mathematical Statistics, 1963, 34(1): 152- 177 doi: 10.1214-aoms-1177704250/ [56] Papoulis A. Probability, Random Variables, and Stochastic Processes. NewYork: McGraw-Hill College, 1965. [57] Freitas C C, Frery A C, Correia A H. The polarimetric G distribution for SAR data analysis. Environmetrics, 2005, 16(1): 13-31 doi: 10.1002/env.658 [58] Khan S, Guida R. On single-look multivariate G distribution for PolSAR data. IEEE Journal of Selected Topics in Applied Earth Observations and Remote Sensing, 2012, 5(4): 1149-1163 doi: 10.1109/JSTARS.2012.2202557 [59] Doulgeris A P, Anfinsen S N, Eltoft T. Classification with a non-Gaussian model for PolSAR data. IEEE Transactions on Geoscience and Remote Sensing, 2008, 46(10): 2999- 3009 doi: 10.1109/TGRS.2008.923025 [60] Bombrun L, Beaulieu J -M. Fisher distribution for texture modeling of polarimetric SAR data. IEEE Geoscience and Remote Sensing Letters, 2008, 5(3): 512-516 doi: 10.1109/LGRS.2008.923262 [61] Frery A C, Cintra R J, Nascimento A D C. Entropy-based statistical analysis of PolSAR data. IEEE Transactions on Geoscience and Remote Sensing, 2013, 51(6): 3733-3743 doi: 10.1109/TGRS.2012.2222029 [62] Uhlmann S, Kiranyaz S. Integrating color features in polarimetric SAR image classification. IEEE Transactions on Geoscience and Remote Sensing, 2014, 52(4): 2197-2216 doi: 10.1109/TGRS.2013.2258675 [63] Dai D X, Yang W, Sun H. Multilevel local pattern histogram for SAR image classification. IEEE Geoscience and Remote Sensing Letters, 2011, 8(2): 225-229 doi: 10.1109/LGRS.2010.2058997 [64] Masjedi A, Zoej M J V, Maghsoudi Y. Classification of polarimetric SAR images based on modeling contextual information and using texture features. IEEE Transactions on Geoscience and Remote Sensing, 2016, 54(2): 932-943 doi: 10.1109/TGRS.2015.2469691 [65] Liu B, Zhang Z H, Liu X Z, Yu W X. Representation and spatially adaptive segmentation for PolSAR images based on wedgelet analysis. IEEE Transactions on Geoscience and Remote Sensing, 2015, 53(9): 4797-4809 doi: 10.1109/TGRS.2015.2410177 [66] Xing Y X, Zhang Y, Li N, Wang R, Hu G X. Improved superpixel-based polarimetric synthetic aperture radar image classification integrating color features. Journal of Applied Remote Sensing, 2016, 10(2): Article No. 026026- 026 https://www.researchgate.net/publication/303594157_Improved_superpixel-based_polarimetric_synthetic_aperture_radar_image_classification_integrating_color_features [67] Liu H Y, Wang S, Wang R F, Shi J F, Zhang E L, Yang S Y, Jiao L. A framework for classification of urban areas using polarimetric SAR images integrating color features and statistical model. Journal of Infrared and Millimeter Waves, 2016, 35(4): 398-406 http://www.wanfangdata.com.cn/details/detail.do?_type=perio&id=hwyhmb201604004 [68] Liu F, Shi J F, Jiao L C, Liu H Y, Yang S Y, Wu J, Hao H X, Yuan J L. Hierarchical semantic model and scattering mechanism based PolSAR image classification. Pattern Recognition, 2016, 59: 325-342 doi: 10.1016/j.patcog.2016.02.020 [69] Xiang D L, Ban Y F, Wang W, Su Y. Adaptive superpixel generation for polarimetric SAR images with local iterative clustering and SIRV model. IEEE Transcactions on Geoscience and Remote Sensing, 2017, 55(6): 3115-3131 doi: 10.1109/TGRS.2017.2662010 [70] Liu B, Hu H, Wang H Y, Wang K Z, Liu X Z, Yu W X. Superpixel-based classification with an adaptive number of classes for polarimetric SAR images. IEEE Transactions on Geoscience and Remote Sensing, 2013, 51(2): 907-924 doi: 10.1109/TGRS.2012.2203358 [71] Wu Y H, Ji K F, Yu W X, Su Y. Region-based classification of polarimetric SAR images using Wishart MRF. IEEE Geoscience and Remote Sensing Letters, 2008, 5(4): 668- 672 doi: 10.1109/LGRS.2008.2002263 [72] Ersahin K, Cumming I G, Ward R K. Segmentation and classification of polarimetric SAR data using spectral graph partitioning. IEEE Transactions on Geoscience and Remote Sensing, 2010, 48(1): 164-174 doi: 10.1109/TGRS.2009.2024303 [73] Du L J, Lee J S, Hoppel K, Mango S A. Segmentation of SAR images using the wavelet transform. International Journal of Imaging Systems and Technology, 1992, 4(4): 319-326 http://www.wanfangdata.com.cn/details/detail.do?_type=perio&id=10.1002/ima.1850040411 [74] Rignot E, Chellappa R. Segmentation of polarimetric synthetic aperture radar data. IEEE Transactions on Image Processing, 1992, 1(3): 281-300 doi: 10.1109/83.148603 [75] Ren B, Hou B, Zhao J, Jiao L C. Unsupervised classification of polarimetirc SAR image via improved manifold regularized low-rank representation with multiple features. IEEE Journal of Selected Topics in Applied Earth Observations and Remote Sensing, 2017, 10(2): 580-595 doi: 10.1109/JSTARS.2016.2573380 [76] Kim H, Hirose A. Unsupervised hierarchical land classification using self-organizing feature codebook for decimeter-resolution PolSAR. IEEE Transactions on Geoscience and Remote Sensing, 2019, 57(4): 1894-1905 doi: 10.1109/TGRS.2018.2870134 [77] 石俊飞, 刘芳, 林耀海, 刘璐.基于深度学习和层次语义模型的极化SAR分类.自动化学报, 2017, 43(2): 215-2265 http://www.aas.net.cn/CN/abstract/abstract19010.shtmlShi Jun-Fei, Liu Fang, Lin Yao-Hai, Liu Lu. Polarimetric SAR image classification based on deep learning and hierarchical semantic model. Acta Automatica Sinica, 2017, 43(2): 215-2265 http://www.aas.net.cn/CN/abstract/abstract19010.shtml [78] Liu H Y, Wang Y K, Yang S Y, Wang S, Feng J, Jiao L C. Large polarimetric SAR data semi-supervised classification with spatial-anchor graph. IEEE Journal of Selected Topics in Applied Earth Observations and Remote Sensing, 2016, 9(4): 1439-1458 doi: 10.1109/JSTARS.2016.2518675 [79] Zhou Y, Wang H P, Xu F, Jin Y Q. Polarimetric SAR image classification using deep convolutional neural networks. IEEE Geoscience and Remote Sensing Letters, 2016, 13(12): 1935-1939 doi: 10.1109/LGRS.2016.2618840 [80] Zhang Z M, Wang H P, Xu F, Jin Y Q. Complex-valued convolutional neural network and its application in polarimetricv SAR image classification. IEEE Transactions on Geoscience and Remote Sensing, 2017, 55(12): 7177-7188 doi: 10.1109/TGRS.2017.2743222 [81] Liu F, Jiao L C, Hou B, Yang S Y. Pol-SAR image classification based on Wishart DBN and local spatial information. IEEE Transactions on Geoscience and Remote Sensing, 2016, 54(6): 3292-3308 doi: 10.1109/TGRS.2016.2514504 [82] Hou B, Kou H D, Jiao L C. Classification of polarimetric SAR images using multilayer autoencoders and superpixels. IEEE Journal of Selected Topics in Applied Earth Observations and Remote Sensing, 2016, 9(7): 3072-3081 doi: 10.1109/JSTARS.2016.2553104 [83] Lee J S, Hoppel K W, Mango S A, Miller A R. Intensity and phase statistics of multilook polarimetric and interferometric SAR imagery. IEEE Transactions on Geoscience and Remote Sensing, 1994, 32(5): 1017-1028 doi: 10.1109/36.312890 [84] Frery A C, Correia A H, Da Freitas C. Classifying multifrequency fully polarimetric imagery with multiple sources of statistical evidence and contextual information. IEEE Transactions on Geoscience and Remote Sensing, 2007, 45(10): 3098-3109 doi: 10.1109/TGRS.2007.903828 [85] Gou S P, Qiao X, Zhang X R, Wang W F, Du F F. Eigenvalue analysis-based approach for POL-SAR image classification. IEEE Transactions on Geoscience and Remote Sensing, 2014, 52(2): 805-818 doi: 10.1109/TGRS.2013.2244096 [86] Alberga V, Borghys D, Satalino G, Staykova D K, Borghgraef A, Lapierre F, Perneel C, et al. Comparison of algorithms for the classification of polarimetric SAR data. In: Proceedings of the 2009 SPIE 7477 — Image and Signal Processing for Remote Sensing XV. Berlin, Germany: SPIE, 2009. Article No. 7477-74771V https://www.researchgate.net/publication/228633764_Comparison_of_algorithms_for_the_classification_of_polarimetric_SAR_data [87] Kajimoto M, Susaki J. Urban-area extraction from polarimetric SAR images using polarization orientation angle. IEEE Geoscience and Remote Sensing Letters, 2013, 10(2): 337-341 doi: 10.1109/LGRS.2012.2207085 [88] Yang W, Yin X S, Song H, Liu Y, Xu X. Extraction of built-up areas from fully polarimetric SAR imagery via PU learning. IEEE Journal of Selected Topics in Applied Earth Observations and Remote Sensing, 2014, 7(4): 1207-1216 doi: 10.1109/JSTARS.2013.2289986 [89] Banerjee B, Bhattacharya A, Buddhiraju K M. A generic land-cover classification framework for polarimetric SAR images using the optimum Touzi decomposition parameter subset-an insight on mutual information-based feature selection techniques. IEEE Journal of Selected Topics in Applied Earth Observations and Remote Sensing, 2014, 7(4): 1167-1176 doi: 10.1109/JSTARS.2014.2304456 [90] Jafari M, Maghsoudi Y, Zoej M J V. A new method for land cover characterization and classification of polarimetric SAR data using polarimetric signatures. IEEE Journal of Selected Topics in Applied Earth Observations and Remote Sensing, 2015, 8(7): 3595-3607 doi: 10.1109/JSTARS.2014.2387374 [91] Fukuda S, Hirosawa H. A wavelet-based texture feature set applied to classification of multifrequency polarimetric SAR images. IEEE Transactions on Geoscience and Remote Sensing, 1999, 37(5): 2282-2286 doi: 10.1109/36.789624 [92] He C, Li S, Liao Z X, Liao M S. Texture classification of PolSAR data based on sparse coding of wavelet polarization textons. IEEE Transactions on Geoscience and Remote Sensing, 2013, 51(8): 4576-4590 doi: 10.1109/TGRS.2012.2236338 [93] Zhang L M, Zou B, Zhang J P, Zhang Y. Classification of polarimetric SAR image based on support vector machine using multiple-component scattering model and texture features. EURASIP Journal on Advances in Signal Processing, 2010(1): Article No. 960831 doi: 10.1155%2F2010%2F960831 [94] Wu W J, Guo H D, Li X W. Urban area SAR image man-made target extraction based on the product model and the time-frequency analysis. IEEE Journal of Selected Topics in Applied Earth Observations and Remote Sensing, 2015, 8(3): 943-952 doi: 10.1109/JSTARS.2014.2371064 [95] Shi L, Zhang L F, Yang J, Zhang L P, Li P X. Supervised graph embedding for polarimetric SAR image classification. IEEE Geoscience and Remote Sensing Letters, 2013, 10(2): 216-220 doi: 10.1109/LGRS.2012.2198612 [96] Tao M L, Zhou F, Liu Y, Zhang Z J. Tensorial independent component analysis-based feature extraction for polarimetric SAR data classification. IEEE Transactions on Geoscience and Remote Sensing, 2015, 53(5): 2481-2495 doi: 10.1109/TGRS.2014.2360943 [97] Huang X Y, Qiao H, Zhang B, Nie X L. Supervised polarimetric SAR image classification using tensor local discriminant embedding. IEEE Transactions on Image Processing, 2018, 27(6): 2966-2979 doi: 10.1109/TIP.2018.2815759 [98] Nie X L, Ding S G, Zhang B, Qiao H, Huang X Y. PolSAR data online classification based on multi-view learning. In: Proceedings of the 24th IEEE International Conference on Image Processing (ICIP). Beijing, China: IEEE, 2017. 2354-2358 https://www.researchgate.net/publication/323349225_Polsar_data_online_classification_based_on_multi-view_learning [99] Nie X L, Luo Y K, Qiao H, Zhang B, Jiang Z P. An incremental multi-view active learning algorithm for PolSAR data classification. In: Proceedings of the 24th International Conference on Pattern Recognition (ICPR). Beijing, China: IEEE, 2018. 2251-2255 https://nyuscholars.nyu.edu/en/publications/an-incremental-multi-view-active-learning-algorithm-for-polsar-da [100] Nie X L, Ding S G, Huang X Y, Qiao H, Zhang B, Jiang Z P. An online multi-view learning algorithm for PolSAR data real-time classification. IEEE Journal of Selected Topics in Applied Earth Observations and Remote Sensing, 2019, 12(1): 302-320 doi: 10.1109/JSTARS.2018.2886821 [101] Huang X Y, Zhang B, Qiao H, Nie X L. Local discriminant canonical correlation analysis for supervised PolSAR image classification. IEEE Geoscience and Remote Sensing Letters, 2017, 14(11): 2102-2106 doi: 10.1109/LGRS.2017.2752800 [102] Kong J, Swartz A A, Yueh H A, Novak L M, Shin R T. Identification of terrain cover using the optimum polarimetric classifier. Journal of Electromagnetic Waves and Applications, 1988, 2(2): 171-194 http://www.wanfangdata.com.cn/details/detail.do?_type=perio&id=10.1163/156939387X00324 [103] Lee J S, Grunes M R, Kwok R. Classification of multi-look polarimetric SAR imagery based on complex Wishart distribution. International Journal of Remote Sensing, 1994, 15(11): 2299-2311 doi: 10.1080/01431169408954244 [104] Pottier E, Saillard J. On radar polarization target decomposition theorems with application to target classification, by using neural network method. In: Proceedings of the 7th International Conference on Antennas and Propagation (ICAP). York, UK, USA: IET, 1991. 265-268 [105] Chen K S, Huang W P, Tsay D H, Amar F. Classification of multifrequency polarimetric SAR imagery using a dynamic learning neural network. IEEE Transactions on Geoscience and Remote Sensing, 1996, 34(3): 814-820 doi: 10.1109/36.499786 [106] Tzeng Y C, Chen K S. A fuzzy neural network to SAR image classification. IEEE Transactions on Geoscience and remote Sensing, 1998, 36(1): 301-307 doi: 10.1109/36.655339 [107] Ince T, Kiranyaz S, Gabbouj M. Evolutionary RBF classifier for polarimetric SAR images. Expert Systems with Applications, 2012, 39(5): 4710-4717 doi: 10.1016/j.eswa.2011.09.082 [108] Shang F, Hirose A. Quaternion neural-network-based PolSAR land classification in Poincare-sphere-parameter space. IEEE Transactions on Geoscience and Remote Sensing, 2014, 52(9): 5693-5703 doi: 10.1109/TGRS.2013.2291940 [109] Antropov O, Rauste Y, Astola H, Praks J, Häme T, Hallikainen M T. Land cover and soil type mapping from spaceborne PolSAR data at L-band with probabilistic neural network. IEEE Transactions on Geoscience and Remote Sensing, 2014, 52(9): 5256-5270 doi: 10.1109/TGRS.2013.2287712 [110] Fukuda S, Hirosawa H. Support vector machine classification of land cover: application to polarimetric SAR data. In: Proceedings of the 2001 International Geoscience and Remote Sensing Symposium. Scanning the Present and Resolving the Future. Sydney, NSW, Australia: IEEE, 2001. 187-189 https://ieeexplore.ieee.org/document/976097 [111] Lardeux C, Frison P L, Tison C, Souyris J C, Stoll B, Fruneau B, Rudant J P, et al. Support vector machine for multifrequency SAR polarimetric data classification. IEEE Transactions on Geoscience and Remote Sensing, 2009, 47(12): 4143-4152 doi: 10.1109/TGRS.2009.2023908 [112] Maghsoudi Y, Collins M J, Leckie D G. Radarsat-2 polarimetric SAR data for boreal forest classification using SVM and a wrapper feature selector. IEEE Journal of Selected Topics in Applied Earth Observations and Remote Sensing, 2013, 6(3): 1531-1538 doi: 10.1109/JSTARS.2013.2259219 [113] Zhang L M, Sun L J, Zou B, Moon W M. Fully polarimetric SAR image classification via sparse representation and polarimetric features. IEEE Journal of Selected Topics in Applied Earth Observations and Remote Sensing, 2015, 8(8): 3923-3932 doi: 10.1109/JSTARS.2014.2359459 [114] 文伟, 王英华, 冯博, 刘宏伟.基于监督非相干字典学习的极化SAR图像舰船目标检测.自动化学报, 2015, 41(11): 1926- 1940 http://www.aas.net.cn/CN/abstract/abstract18767.shtmlWen Wei, Wang Ying-Hua, Feng Bo, Liu Hong-Wei. Supervised incoherent dictionary learning for ship detection with PolSAR images. Acta Automatica Sinica, 2015, 41(11): 1926-1940 http://www.aas.net.cn/CN/abstract/abstract18767.shtml [115] 何楚, 刘明, 冯倩, 邓新萍.基于多尺度压缩感知金字塔的极化干涉SAR图像分类.自动化学报, 2011, 37(7): 820-827 http://www.aas.net.cn/CN/abstract/abstract17450.shtmlHe Chu, Liu Ming, Feng Qian, Deng Xin-Ping. PolInSAR Image classification based on compressed sensing and multi-scale pyramid. Acta Automatica Sinica, 2011, 37(7): 820-827 http://www.aas.net.cn/CN/abstract/abstract17450.shtml [116] She X L, Yang J, Zhang W J. The boosting algorithm with application to polarimetric SAR image classification. In: Proceedings of the 1st Asian and Pacific Conference on Synthetic Aperture Radar. Huangshan, China: IEEE, 2007. 779-783 https://www.researchgate.net/publication/224300179_The_boosting_algorithm_with_application_to_polarimetric_SAR_image_classification [117] Zou T Y, Yang W, Dai D X, Sun H. Polarimetric SAR image classification using multifeatures combination and extremely randomized clustering forests. EURASIP Journal on Advances in Signal Processing, 2010, 2010(4): Article No. 4 doi: 10.1155/2010/465612 [118] Mishra P, Singh D. A statistical-measure-based adaptive land cover classification algorithm by efficient utilization of polarimetric SAR observables. IEEE Transactions on Geoscience and Remote Sensing, 2014, 52(5): 2889-2900 doi: 10.1109/TGRS.2013.2267548 [119] Gomez L, Alvarez L, Mazorra L, Frery A C. Fully PolSAR image classification using machine learning techniques and reaction-diffusion systems. Neurocomputing, 2017, 255: 52-60 doi: 10.1016/j.neucom.2016.08.140 [120] Maghsoudi Y, Collins M, Leckie D G. Polarimetric classification of boreal forest using nonparametric feature selection and multiple classifiers. International Journal of Applied Earth Observation and Geoinformation, 2012, 19: 139-150 doi: 10.1016/j.jag.2012.04.015 [121] Ma X S, Shen H F, Yang J, Zhang L P, Li P X. Polarimetric-spatial classification of SAR images based on the fusion of multiple classifiers. IEEE Journal of Selected Topics in Applied Earth Observations and Remote Sensing, 2014, 7(3): 961-971 doi: 10.1109/JSTARS.2013.2265331 [122] Kiranyaz S, Ince T, Uhlmann S, Gabbouj M. Collective network of binary classifier framework for polarimetric SAR image classification: an evolutionary approach. IEEE Transactions on Systems, Man, and Cybernetics, Part B (Cybernetics), 2012, 42(4): 1169-1186 doi: 10.1109/TSMCB.2012.2187891 [123] van Zyl J J. Unsupervised classification of scattering behavior using radar polarimetry data. IEEE Transactions on Geoscience and Remote Sensing, 1989, 27(1): 36-45 doi: 10.1109/36.20273 [124] Cloude S R, Pottier E. An entropy based classification scheme for land applications of polarimetric SAR. IEEE Transactions on Geoscience and Remote Sensing, 1997, 35(1): 68-78 doi: 10.1109/36.551935 [125] Xu F, Jin Y -Q. Deorientation theory of polarimetric scattering targets and application to terrain surface classification. IEEE Transactions on Geoscience and Remote Sensing, 2005, 43(10): 2351-2364 doi: 10.1109/TGRS.2005.855064 [126] Chen Q, Kuang G Y, Li J, Sui L C, Li D G. Unsupervised land cover/land use classification using PolSAR imagery based on scattering similarity. IEEE Transactions on Geoscience and Remote Sensing, 2013, 51(3): 1817-1825 doi: 10.1109/TGRS.2012.2205389 [127] Xiang D L, Tang T, Ban Y F, Su Y, Kuang G Y. Unsupervised polarimetric SAR urban area classification based on model-based decomposition with cross scattering. ISPRS Journal of Photogrammetry and Remote Sensing, 2016, 116: 86-100 doi: 10.1016/j.isprsjprs.2016.03.009 [128] Doulgeris A P, Anfinsen S N, Eltoft T. Automated non-Gaussian clustering of polarimetric synthetic aperture radar images. IEEE Transactions on Geoscience and Remote Sensing, 2011, 49(10): 3665-3676 doi: 10.1109/TGRS.2011.2140120 [129] Bombrun L, Vasile G, Gay M, Totir F. Hierarchical segmentation of polarimetric SAR images using heterogeneous clutter models. IEEE Transactions on Geoscience and Remote Sensing, 2011, 49(2): 726-737 doi: 10.1109/TGRS.2010.2060730 [130] Frery A C, Jacobo-Berlles J, Gambini J, Mejail M E. Polarimetric SAR image segmentation with B-splines and a new statistical model. Multidimensional Systems and Signal Processing, 2010, 21(4): 319-342 doi: 10.1007/s11045-010-0113-4 [131] Silva W B, Freitas C C, Sant$'$Anna S J, Frery A C. Classification of segments in PolSAR imagery by minimum stochastic distances between Wishart distributions. IEEE Journal of Selected Topics in Applied Earth Observations and Remote Sensing, 2013, 6(3): 1263-1273 doi: 10.1109/JSTARS.2013.2248132 [132] Lee J S, Grunes M R, Ainsworth T L, Du L J, Schuler D L, Cloude S R. Unsupervised classification using polarimetric decomposition and the complex Wishart classifier. IEEE Transactions on Geoscience and Remote Sensing, 1999, 37(5): 2249-2258 doi: 10.1109/36.789621 [133] Ferro-Famil L, Pottier E, Lee J -S. Unsupervised classification of multifrequency and fully polarimetric SAR images based on the H/A/AlphaK-Wishart classifier. IEEE Transactions on Geoscience and Remote Sensing, 2001, 39(11): 2332-2342 doi: 10.1109/36.964969 [134] Park S E, Moon W M. Unsupervised classification of scattering mechanisms in polarimetric SAR data using fuzzy logic in entropy and alpha plane. IEEE Transactions on Geoscience and Remote Sensing, 2007, 45(8): 2652-2664 doi: 10.1109/TGRS.2007.897691 [135] Lee J S, Grunes M R, Pottier E, Ferro-Famil L. Unsupervised terrain classification preserving polarimetric scattering characteristics. IEEE Transactions on Geoscience and Remote Sensing, 2004, 42(4): 722-731 doi: 10.1109/TGRS.2003.819883 [136] Hou B, Chen C, Liu X J, Jiao L C. Multilevel distribution coding model-based dictionary learning for PolSAR image classification. IEEE Journal of Selected Topics in Applied Earth Observations and Remote Sensing, 2015, 8(11): 5262-5280 doi: 10.1109/JSTARS.2015.2460998 [137] Cao F, Hong W, Wu Y R, Pottier E. An unsupervised segmentation with an adaptive number of clusters using the SPAN/H/α K/A space and the complex Wishart clustering for fully polarimetric SAR data analysis. IEEE Transactions on Geoscience and Remote Sensing, 2007, 45(11): 3454-3467 doi: 10.1109/TGRS.2007.907601 [138] Dabboor M, Collins M J, Karathanassi V, Braun A. An unsupervised classification approach for polarimetric SAR data based on the chernoff distance for complex wishart distribution. IEEE Transactions on Geoscience and Remote Sensing, 2013, 51(7): 4200-4213 doi: 10.1109/TGRS.2012.2227755 [139] Kersten P R, Lee J S, Ainsworth T L. Unsupervised classification of polarimetric synthetic aperture radar images using fuzzy clustering and EM clustering. IEEE Transactions on Geoscience and Remote Sensing, 2005, 43(3): 519-527 doi: 10.1109/TGRS.2004.842108 [140] Wang Y H, Han C Z, Tupin F. PolSAR data segmentation by combining tensor space cluster analysis and Markovian framework. IEEE Geoscience and Remote Sensing Letters, 2010, 7(1): 210-214 doi: 10.1109/LGRS.2009.2031660 [141] Yu P, Qin A K, Clausi D A. Unsupervised polarimetric SAR image segmentation and classification using region growing with edge penalty. IEEE Transactions on Geoscience and Remote Sensing, 2012, 50(4): 1302-1317 doi: 10.1109/TGRS.2011.2164085 [142] Doulgeris A P. An automatic U-distribution and Markov random field segmentation algorithm for PolSAR images. IEEE Transactions on Geoscience and Remote Sensing, 2015, 53(4): 1819-1827 doi: 10.1109/TGRS.2014.2349575 [143] Bi H X, Sun J, Xu Z B. Unsupervised PolSAR image classification using discriminative clustering. IEEE Transactions on Geoscience and Remote Sensing, 2017, 55(6): 3531- 3544 doi: 10.1109/TGRS.2017.2675906 [144] Song W Y, Li M, Zhang P, Wu Y, Jia L, An L. Unsupervised PolSAR image classification and segmentation using Dirichlet process mixture model and Markov random fields with similarity measure. IEEE Journal of Selected Topics in Applied Earth Observations and Remote Sensing, 2017, 10(8): 3556-3568 doi: 10.1109/JSTARS.2017.2684301 [145] Zhong N, Yang W, Cherian A, Yang X L, Xia G S, Liao M S. Unsupervised classification of polarimetric SAR images via Riemannian sparse coding. IEEE Transactions on Geoscience and Remote Sensing, 2017, 55(9): 5381-5390 doi: 10.1109/TGRS.2017.2707243 [146] Kim H, Hirose A. Unsupervised fine land classification using quaternion autoencoder-based polarization feature extraction and self-organizing mapping. IEEE Transactions on Geoscience and Remote Sensing, 2018, 56(3): 1839- 1851 doi: 10.1109/TGRS.2017.2768619 [147] Liu C, Liao W Z, Li H C, Fu K, Philips W. Unsupervised classification of multilook polarimetric SAR data using spatially variant wishart mixture model with double constraints. IEEE Transactions on Geoscience and Remote Sensing, 2018, 56(10): 5600-5613 https://ieeexplore.ieee.org/document/8345175 [148] Hänsch R, Hellwich O. Semi-supervised learning for classification of polarimetric SAR-data. In: Proceedings of the 2009 IEEE International Geoscience and Remote Sensing Symposium. Cape Town, South Africa: IEEE, 2009. Ⅲ-987-Ⅲ-990 https://ieeexplore.ieee.org/document/5417941 [149] Niu X, Ban Y F. An adaptive contextual SEM algorithm for urban land cover mapping using multitemporal high-resolution polarimetric SAR data. IEEE Journal of Selected Topics in Applied Earth Observations and Remote Sensing, 2012, 5(4): 1129-1139 doi: 10.1109/JSTARS.2012.2201448 [150] Uhlmann S, Kiranyaz S, Gabbouj M. Semi-supervised learning for Ill-posed polarimetric SAR classification. Remote Sensing, 2014, 6(6): 4801-4830 doi: 10.3390/rs6064801 [151] Wei B H, Yu J, Wang C, Wu H Y, Li J. PolSAR image classification using a semi-supervised classifier based on hypergraph learning. Remote Sensing Letters, 2014, 5(4): 386-395 doi: 10.1080/2150704X.2014.912765 [152] Liu H Y, Zhu D X, Yang S Y, Hou B, Gou S P, Xiong T, Jiao L, et al. Semisupervised feature extraction with neighborhood constraints for polarimetric SAR classification. IEEE Journal of Selected Topics in Applied Earth Observations and Remote Sensing, 2016, 9(7): 3001-3015 doi: 10.1109/JSTARS.2016.2532922 [153] Hua W Q, Wang S, Liu H Y, Liu K, Guo Y H, Jiao L C. Semisupervised PolSAR image classification based on improved cotraining. IEEE Journal of Selected Topics in Applied Earth Observations and Remote Sensing, 2017, 10(11): 4971-4986 doi: 10.1109/JSTARS.2017.2728067 [154] Hou B, Wu Q, Wen Z D, Jiao L C. Robust semisupervised classification for PolSAR image with noisy labels. IEEE Transactions on Geoscience and Remote Sensing, 2017, 55(11): 6440-6455 doi: 10.1109/TGRS.2017.2728186 [155] Zhang D, Jiao L C, Bai X, Wang S, Hou B. A robust semi-supervised SVM via ensemble learning. Applied Soft Computing, 2018, 65: 632-643 doi: 10.1016/j.asoc.2018.01.038 [156] Liu H Y, Yang S Y, Gou S P, Liu S, Jiao L C. Terrain classification based on spatial multi-attribute graph using polarimetric SAR data. Applied Soft Computing, 2018, 68: 24-38 doi: 10.1016/j.asoc.2018.03.029 [157] Geng J, Ma X R, Fan J C, Wang H Y. Semisupervised classification of polarimetric SAR image via superpixel restrained deep neural network. IEEE Geoscience and Remote Sensing Letters, 2018, 15(1): 122-126 doi: 10.1109/LGRS.2017.2777450 [158] Lecun Y, Bottou L, Bengio Y, Haffner P. Gradient-based learning applied to document recognition. Proceedings of the IEEE, 1998, 86(11): 2278-2324 doi: 10.1109/5.726791 [159] Hinton G E, Osindero S, Teh Y W. A fast learning algorithm for deep belief nets. Neural Computation, 2006, 18(7): 1527-1554 doi: 10.1162/neco.2006.18.7.1527 [160] Bengio Y. Learning deep architectures for AI. Foundations and Trends in Machine Learning, 2009, 2(1): 1-127 http://d.old.wanfangdata.com.cn/OAPaper/oai_arXiv.org_1206.5538 [161] Rasmus A, Valpola H, Honkala M, Berglund M, Honkala M, Valpola H, Raiko T. Semi-supervised learning with ladder networks. In: Proceedings of the 28th International Conference on Neural Information Processing Systems Advances in Neural Information Processing Systems. Montreal, Canada: ACM, 2015. 3546-3554 https://arxiv.org/abs/1507.02672 [162] Jiao L C, Liu F. Wishart deep stacking network for fast PolSAR image classification. IEEE Transactions on Image Processing, 2016, 25(7): 3273-3286 doi: 10.1109/TIP.2016.2567069 [163] Zhang L, Ma W P, Zhang D. Stacked sparse autoencoder in PolSAR data classification using local spatial information. IEEE Geoscience and Remote Sensing Letters, 2016, 13(9): 1359-1363 doi: 10.1109/LGRS.2016.2586109 [164] Xie W, Jiao L C, Hou B, Ma W P, Zhao J, Zhang S Y, Liu F, et al. PolSAR image classification via Wishart-AE model or Wishart-CAE model. IEEE Journal of Selected Topics in Applied Earth Observations and Remote Sensing, 2017, 10(8): 3604-3615 doi: 10.1109/JSTARS.2017.2698076 [165] Liu H Y, Yang S Y, Gou S P, Zhu D X, Wang R F, Jiao L C. Polarimetric SAR feature extraction with neighborhood preservation-based deep learning. IEEE Journal of Selected Topics in Applied Earth Observations and Remote Sensing, 2017, 10(4): 1456-1466 doi: 10.1109/JSTARS.2016.2618891 -

 下载:
下载:

计量
- 文章访问数: 2041
- HTML全文浏览量: 1232
- PDF下载量: 206
- 被引次数: 0
