

-
摘要: 针对混合属性数据聚类结果精度不高、聚类结果对参数敏感等问题, 提出了基于残差分析的混合属性数据聚类算法(Clustering algorithm for mixed data based on residual analysis) RA-Clust.算法以改进的熵权重混合属性相似性度量对象间的相似性, 以提出的基于KNN和Parzen窗的局部密度计算方法计算每个对象的密度, 通过线性回归和残差分析进行聚类中心预选取, 然后以提出的聚类中心目标优化模型确定真正的聚类中心, 最后将其他数据对象按照距离高密度对象的最小距离划分到相应的簇中, 形成最终聚类.在合成数据集和UCI数据集上的实验结果验证了算法的有效性.与同类算法相比, RA-Clust具有较高的聚类精度.Abstract: For the existing mixed data clustering algorithm, there are some problems such as low clustering accuracy and parameters sensitive, a clustering algorithm for mixed data based on residual analysis (RA-Clust) is proposed. We use entropy weight to measure the similarity between objects with mixed attributes. Based on KNN and Parzen windows, we propose a method to calculate the local density of objects. Pre-selected cluster centers is conducted by linear regression and residual analysis. Then, the true cluster centers are selected according to objective optimization model proposed in this paper. Finally, the remaining objects are assigned into corresponding clusters according to the minimum distance from the high density objects. The experimental results on synthetic datasets and UCI datasets verify the effectiveness. Compared with similar algorithms, RA-Clust has a higher clustering accuracy.
-
Key words:
- Clustering /
- residual analysis /
- linear regression /
- mixed data /
- cluster center
1) 本文责任编委 张敏灵 -
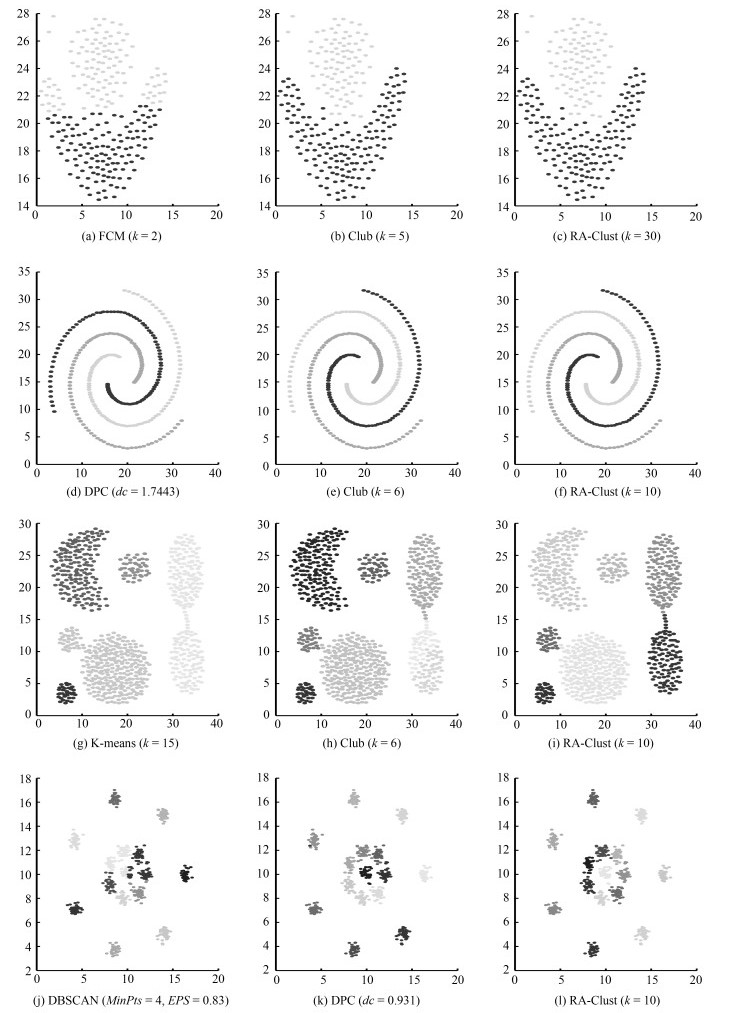
图 3 各算法在二维数据集上的聚类结果
Fig. 3 The clustering results of each algorithm on two-dimensional datasets
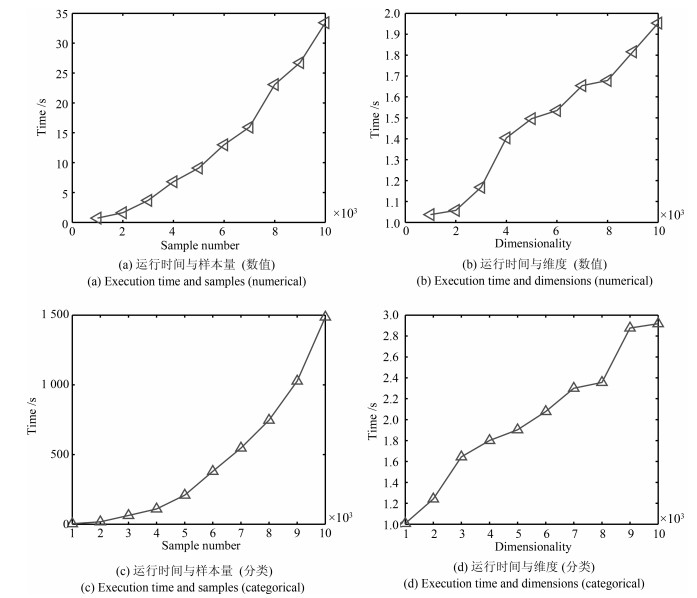
图 5 算法的运行时间与样本量、维度的关系
Fig. 5 Effect of the number of dimensions and samples on the execution time
表 1 目标优化模型的迭代计算过程
Table 1 Iterative calculation process of objective optimization model
P1-P2 P1-P3 P1-P4 P1-P5 P1-P6 P1-P7 P1-P8 P1-P9 P1-P10 P1-P11 P1-P12 P1-P13 U 1.0369 1.2274 1.4342 1.4336 1.3781 1.3433 1.3957 1.2310 1.2207 1.1352 1.2556 1.2315 DBI 0.4074 0.4647 0.8507 0.6806 0.5671 0.5092 0.6260 0.4740 0.4140 0.3295 0.5415 0.4998 SC 0.3335 0.0099 $-$0.0178 $-$0.1866 $-$0.8192 $-$0.1775 $-$0.1655 0.0120 $-$0.0275 0.0588 0.0303 0.0367  下载: 导出CSV
表 2 $\alpha$的取值与聚类中心个数
Table 2 The value of alpha and the number of cluster centers
$\alpha$ 0.6 0.5 0.1 0.05 0.02 0.01 0.001 0.0001 DC-MDACC 9 9 7 5 4 3 3 3 RA-Clust 2 2 2 2 2 2 2 2
下载: 导出CSV
表 3 数据集的基本信息
Table 3 The basic information of the datasets
No. Datasets Data Sources $m$ $m_r$ $m_c$ Class Instance 1 Flame Synthesis 2 2 0 2 240 2 R15 Synthesis 2 2 0 15 600 3 Spiral Synthesis 2 2 0 3 312 4 Aggregation Synthesis 2 2 0 7 788 5 Seeds UCI 7 7 0 3 210 6 Wine UCI 13 13 0 3 178 7 Soybean UCI 35 0 35 4 47 8 SPECT Heart UCI 22 0 22 2 267 9 Tic-tac-toe UCI 10 0 10 2 958 10 Congressional Voting UCI 16 0 16 2 435 11 Australian Credit Approval UCI 14 6 8 2 690 12 Credit Approval UCI 15 6 9 2 690 13 Heart Disease UCI 13 6 7 2 303 14 German Credit UCI 20 7 13 2 1 000 15 ZOO UCI 16 1 15 7 101 16 Japanese Credit UCI 15 6 9 2 690 17 Post Operative Patient UCI 8 1 7 3 90 18 Hepatitis UCI 19 6 13 2 155
下载: 导出CSV
表 4 数值属性数据集上的聚类结果比较
Table 4 Comparison of clustering results on numerical attribute datasets
数据集 算法 参数 ACC (%) NMI Purity JC RI FMI Flame K-means $k = 2$ 82.9167 0.3939 0.8292 0.5684 0.7155 0.7253 DPC $dc = 0.9301$ 78.7500 0.4131 0.7875 0.5133 0.6639 0.6786 DBSCAN $MinPts = 4$, $EPS = 0.83$ 94.1667 0.8448 0.9875 0.9144 0.9540 0.9561 FCM $k = 2$ 85 0.4420 0.8500 0.6032 0.7439 0.7530 CLUB $k = 5$ 100 1 1 1 1 1 RA-Clust $k = 60$ 100 1 1 1 1 1 Spiral K-means $k = 3$ 34.6154 0.00005 0.3494 0.1960 0.5540 0.3278 DPC $dc = 1.7443$ 100 1 1 1 1 1 DBSCAN $MinPts = 10$, $EPS = 1$ 100 1 1 1 1 1 FCM $k = 3$ 33.9744 0.00002 0.3429 0.1956 0.5541 0.3272 CLUB $k = 6$ 100 1 1 1 1 1 RA-Clust $k = 10$ 100 1 1 1 1 1 Aggregation K-means $k = 7$ 73.3503 0.8036 0.8883 0.5676 0.8958 0.7321 DPC $dc = 1$ 94.0355 0.9705 0.9987 0.9591 0.9911 0.9793 DBSCAN $MinPts = 4$, $EPS = 0.83$ 82.7411 0.8894 0.8274 1 1 1 FCM $k = 7$ 79.6954 0.8427 0.9315 0.6433 0.9187 0.7926 CLUB $k = 6$ 100 1 1 1 1 1 RA-Clust $k = 12$ 99.8731 0.9957 0.9987 0.9966 0.9993 0.9983 R15 K-means $k = 15$ 79.5000 0.8989 0.7950 0.6075 0.9606 0.7704 DPC $dc = 0.9500$ 99.5000 0.9922 0.9950 0.9801 0.9987 0.9900 DBSCAN $MinPts = 5$, $EPS = 0.32$ 78.1667 0.9121 0.7850 0.5927 0.9627 0.7642 FCM $k = 15$ 99.6667 0.9942 0.9967 0.9866 0.9991 0.9932 CLUB $k = 7$ 99.5000 0.9913 0.9950 0.9799 0.9987 0.9899 RA-Clust $k = 10$ 100 1 1 1 1 1 Seeds K-means $k = 3$ 55.2381 0.4924 0.6667 0.4430 0.7052 0.6198 DPC $dc = 0.4$ 62.06 0.6560 0.7340 0.6633 0.7125 0.7988 DBSCAN $MinPts = 4$, $EPS = 1.3$ 34.2857 0.0183 0.3429 0.4964 0.7767 0.7046 FCM $k = 3$ 89.5238 0.6744 0.8952 0.6814 0.8743 0.8105 CLUB $k = 24$ 81.3412 0.6612 0.81314 0.6445 0.6122 0.7412 RA-Clust $k = 9$ 89.5238 0.6744 0.8952 0.6815 0.8748 0.8106 Wine K-means $k = 3$ 58.4270 0.3804 0.7047 0.3449 0.7032 0.5160 DPC $dc = 0.3162$ 58.43 0.2802 0.1794 0.5912 0.7016 0.6498 DBSCAN $MinPts = 2$, $EPS = 1.3$ 38.2022 0.0268 0.3989 0.4864 0.7024 0.6888 FCM $k = 3$ 63.7303 0.4073 0.6373 0.6957 0.9034 0.8206 CLUB $k = 24$ 60.3321 0.4101 0.6033 0.6217 0.6234 0.7406 RA-Clust $k = 25$ 64.6067 0.4277 0.6461 0.6671 0.8904 0.8007
下载: 导出CSV
表 5 分类属性数据集上的聚类结果比较
Table 5 Comparison of clustering results on categorical attribute dataset
数据集 算法 参数 ACC (%) NMI Purity JC RI FMI Soybean K-modes $k = 4$ 100 1 1 1 1 1 EKP $k = 4$, $Cp = 0.8$, $Ip = 0.5$ 53.1915 0.2980 0.5745 0.2326 0.6947 0.3774 FKP-MD $Ite = 100$, $k = 4$, $m = 1.1$ 70.2128 0.7892 0.7872 0.5601 0.8205 0.7348 IKP-MD $Ite = 100$, $k = 4$, $\lambda = 0.8$ 100 1 1 1 1 1 DP-MD-FN $dc = 6$ %, $t = 5$ 100 1 1 1 1 1 RA-Clust $k = 30$ 100 1 1 1 1 1 SPECT Heart K-modes $k = 4$ 60.9626 0.0697 0.9198 0.4963 0.5215 0.6768 EKP $k = 2$, $Cp = 0.8$, $Ip = 0.5$ 40.6417 0.0332 0.5241 0.4807 0.8137 0.6831 FKP-MD $Ite = 200$, $k = 2$, $m = 1.4$ 54.5455 0.0494 0.9198 0.4680 0.5015 0.6565 IKP-MD $Ite = 200$, $k = 2$, $\lambda = 0.8$ 67.3797 0.0568 0.9198 0.5398 0.5580 0.7094 DP-MD-FN $dc = 1.5$, $t = 3$ 85.5615 0.8549 0.9198 0.7464 0.7491 0.8549 RA-Clust $k = 65$ 90.3743 0.0071 0.9198 0.8245 0.8249 0.9056 Tia-tac-toe K-modes $k = 2$ 54.6973 0.0005 0.6534 0.3669 0.5039 0.5369 EKP $k = 4$, $Cp = 0.8$, $Ip = 0.5$ 55.33 0.0075 0.6534 0.3560 0.5026 0.5256 FKP-MD $Ite = 100$, $k = 2$, $m = 1.1$ 57.0981 0.0128 0.6534 0.3623 0.5096 0.5324 IKP-MD $Ite = 100$, $k = 2$, $\lambda = 0.8$ 57.9332 0.0078 0.6534 0.3728 0.5121 0.5433 DP-MD-FN $dc = 22.75$ %, $t = 50$ 64.3006 0.0066 0.6534 0.4883 0.5404 0.6674 RA-Clust $k = 44$ 65.6576 0.0067 0.6566 0.5458 0.5486 0.7375 Congressional Voting K-modes $k = 2$ 84.1379 0.4048 0.8414 0.5857 0.7325 0.7389 EKP $k = 2$, $Cp = 0.8$, $Ip = 0.5$ 83.6207 0.3602 0.8362 0.5678 0.7249 0.7244 FKP-MD $Ite = 100$, $k = 2$, $m = 3.6$ 84.9138 0.3962 0.8491 0.5902 0.7427 0.7423 IKP-MD $Ite = 100$, $k = 2$, $\lambda = 2$ 83.1897 0.3641 0.8319 0.5618 0.7191 0.7194 DP-MD-FN $dc = 6.29$ %, $t = 10$ 80.6897 0.3802 0.8069 0.5343 0.6877 0.6966 RA-Clust $k = 10$ 86.2069 0.4501 0.8621 0.7227 0.7116 0.7677
下载: 导出CSV
表 6 混合属性数据集上的聚类结果比较
Table 6 Comparison of clustering results on mixed datasets
数据集 算法 参数 ACC (%) NMI Purity JC RI FMI Disease Heart K-prototypes $k = 2$, $\lambda = 0.4$ 57.7558 0.0143 0.5776 0.3581 0.5101 0.5277 EKP $k = 2$, $Cp = 0.9$, $Ip = 0.1$ 52.4752 0.0065 0.5413 0.4820 0.4996 0.6816 FKP-MD $Ite = 100$, $k = 2$, $m = 1.2$ 52.4752 0 0.5413 0.3349 0.4984 0.5018 DP-MD-FN $dc = 22$ %, $t = 20$ 75.9076 0.2018 0.7591 0.4639 0.6330 0.6338 IKP-MD $Ite = 100$, $k = 2$, $\lambda = 0.8$ 52.1452 0.0026 0.5413 0.3405 0.4993 0.5081 RA-Clust $k = 30$ 77.5578 0.2291 0.7756 0.4858 0.6507 0.6540 Credit Approval K-prototypes $k = 2$, $\lambda = 0.7$ 55.2833 0.0134 0.5528 0.5015 0.5048 0.7062 EKP $k = 2$, $Cp = 0.8$, $Ip = 0.5$ 68.2609 0.1133 0.6826 0.4538 0.5661 0.6292 FKP-MD $Ite = 100$, $k = 2$, $m = 1.3$ 83.7681 0.3733 0.8377 0.5735 0.7277 0.7290 DP-MD-FN $dc = 17$ %, $t = 20$ 82.2358 0.3742 0.8224 0.5522 0.7074 0.7115 IKP-MD $Ite = 100$, $k = 2$, $\lambda = 0.8$ 78.8406 0.2778 0.7884 0.5022 0.6659 0.6687 RA-Clust $k = 70$ 83.3078 0.4013 0.8652 0.5827 0.7438 0.7368 Australian Credit Approval K-prototypes $k = 2$, $\lambda = 0.4$ 56.2319 0.0162 0.5623 0.5030 0.5071 0.7071 EKP $k = 2$, $Cp = 0.8$, $Ip = 0.5$ 55.9001 0.0048 0.5600 0.4566 0.5704 0.6317 FKP-MD $Ite = 100$, $k = 2$, $m = 0.6$ 55.6522 0.0034 0.5565 0.5049 0.5057 0.7101 DP-MD-FN $dc = 18$ %, $t = 20$ 82.1739 0.3611 0.8217 0.5499 0.7066 0.7096 IKP-MD $Ite = 100$, $k = 2$, $\lambda = 0.8$ 81.7391 0.3105 0.8174 0.5469 0.7010 0.7072 RA-Clust $k = 70$ 82.3188 0.3795 0.8652 0.5727 0.7400 0.7295 German Credit K-prototypes $k = 2$, $\lambda = 0.15$ 67.0000 0.0123 0.7000 0.4898 0.5580 0.6610 EKP $k = 2$, $Cp = 0.8$, $Ip = 0.56$ 54.1000 0.0014 0.7000 0.3865 0.5029 0.5578 FKP-MD $Ite = 100$, $k = 2$, $m = 1.4$ 67.0000 0.0096 0.7000 0.4942 0.5574 0.6658 DP-MD-FN $dc = 1.5$, $t = 3$ 65.7000 0.0306 0.0716 0.5121 0.5704 0.6831 IKP-MD $Ite = 130$, $k = 2$, $\lambda = 0.8$ 29.0000 0.0169 0.7000 0.1860 0.4568 0.3542 RA-Clust $k = 80$ 66.3000 0.0308 0.7240 0.5050 0.5717 0.0752 ZOO K-prototypes $k = 7$, $\lambda = 0.6$ 73.2673 0.7236 0.8416 0.5746 0.8798 0.7307 EKP $k = 7$, $Cp = 0.8$, $Ip = 0.5$ 61.3861 0.4641 0.7030 0.3780 0.8061 0.5504 FKP-MD $Ite = 100$, $k = 7$, $m = 2.1$ 83.1683 0.8689 0.4059 0.6488 0.9430 0.8055 DP-MD-FN $dc = 7.94$ %, $t = 11$ 84.1584 0.8077 0.8416 0.8036 0.9523 0.8911 IKP-MD $Ite = 100$, $k = 7$, $\lambda = 0.8$ 87.1287 0.8778 0.9307 0.7749 0.9453 0.8760 RA-Clust $k = 5$ 89.1089 0.8815 0.8911 0.9547 0.9897 0.9770 Post Operative Patient K-prototypes $k = 3$, $\lambda = 0.7$ 62.0690 0.0256 0.7241 0.4355 0.5354 0.6069 EKP $k = 7$, $Cp = 0.8$, $Ip = 0.5$ 67.7778 0.0274 0.7111 0.5398 0.5898 0.7131 FKP-MD $Ite = 200$, $k = 3$, $m = 1.4$ 53.3333 0.0231 0.7111 0.3516 0.4792 0.5210 DP-MD-FN $dc = 81$ %, $t = 3$ 70.1149 0.0110 0.7126 0.5800 0.5924 0.7572 IKP-MD $Ite = 150$, $k = 3$, $\lambda = 0.8$ 41.1111 0.0228 0.7111 0.2641 0.4754 0.4340 RA-Clust $k = 70$ 70.1149 0.0110 0.7326 0.5800 0.5924 0.7572 Japanese Credit K-prototypes $k = 2$, $\lambda = 0.6$ 55.2833 0.0134 0.5528 0.5015 0.5048 0.7062 EKP $k = 2$, $Cp = 0.8$, $Ip = 0.5$ 62.1746 0.0916 0.6738 0.3956 0.5594 0.5669 FKP-MD $Ite = 100$, $k = 7$, $m = 2.1$ 83.3078 0.3539 0.8331 0.5653 0.7215 0.7223 DP-MD-FN $dc = 1.5$, $t = 3$ 56.9678 0.2184 0.7142 0.3657 0.5986 0.5430 IKP-MD $Ite = 130$, $k = 2$, $\lambda = 0.8$ 78.8668 0.2781 0.7887 0.5024 0.6661 0.6688 RA-Clust $k = 80$ 83.3078 0.4013 0.8652 0.5827 0.7438 0.7368 Hepatitis K-prototypes $k = 2$, $\lambda = 0.35$ 65.0000 0.00003 0.8375 0.4794 0.5392 0.6518 EKP $k = 2$, $Cp = 0.8$, $Ip = 0.5$ 78.7500 0.0284 0.8375 0.6554 0.6611 0.7967 FKP-MD $Ite = 100$, $k = 7$, $m = 1.3$ 77.5000 0.2017 0.8375 0.5649 0.6465 0.7290 DP-MD-FN $dc = 7.94$ %, $t = 11$ 78.7500 0.1794 0.8150 0.6541 0.7092 0.7916 IKP-MD $Ite = 300$, $k = 2$, $\lambda = 0.8$ 83.7500 0.2418 0.8375 0.6598 0.7244 0.7974 RA-Clust $k = 10$ 86.2500 0.2847 0.8625 0.7019 0.7598 0.8262
下载: 导出CSV
表 7 算法的时间复杂度分析
Table 7 The time complexity analysis of the algorithms
算法 时间复杂度 K-means ${\rm O}(Item\times n\times k)$[37] FCM ${\rm O}(Item\times n\times k)$[10] DBSCAN ${\rm O}(n^2)$[11] DPC ${\rm O}(n^2)$[12] CLUB ${\rm O}(n\log_2n)$[13] K-prototypes ${\rm O}(\left(s+1 \right)\times k\times n)$[17] EKP ${\rm O}(T\times k\times n)$[15] DC-MDACC ${\rm O}(iter\times m\times n^2)$[22] DP-MD-FN ${\rm O}(\left(r^2m_c^2+m_r^2 \right)N^2)$[18] IKP-MD ${\rm O}(k\left(m+p+Nm-Np \right)nl)$[16] FKP-MD ${\rm O}(m^2n+m^2s^3+k\left(m+p+Nm-Np \right)ns)$[17] RA-Clust ${\rm O}(n\sqrt n)$
下载: 导出CSV
-
[1] Li X L, Han Q, Qiu B Z. A clustering algorithm using skewness-based boundary detection. Neurocomputing, 2018, 275: 618-626 doi: 10.1016/j.neucom.2017.09.023 [2] Han J W, Kamber M. Data Mining: Concepts And Techniques. New York: Morgan Kaufmann, 2006. 384 [3] 王卫卫, 李小平, 冯象初, 王斯琪.稀疏子空间聚类综述.自动化学报, 2015, 41(8): 1373-1384 doi: 10.16383/j.aas.2015.c140891Wang Wei-Wei, Li Xaio-Ping, Feng Xiang-Chu, Wang Si-Qi. A survey on sparse subspace clustering. Acta Automatica Sinica, 2015, 41(8): 1373-1384 doi: 10.16383/j.aas.2015.c140891 [4] Li X L, Geng P, Qiu B Z. A cluster boundary detection algorithm based on shadowed set. Intelligent Data Analysis, 2017, 20(1): 29-45 http://www.wanfangdata.com.cn/details/detail.do?_type=perio&id=49c3755a56d43cb89ea79bb64a46c158 [5] 李向丽, 曹晓锋, 邱保志.基于矩阵模型的高维聚类边界模式发现.自动化学报, 2017, 43(11): 1962-1972 doi: 10.16383/j.aas.2017.c160443Li Xiang-Li, Cao Xiao-Feng, Qiu Bao-Zhi. Clustering boundary pattern discovery for high dimensional space base on matrix model. Acta Automatica Sinica, 2017, 43(11): 1962-1972 doi: 10.16383/j.aas.2017.c160443 [6] Alswaitti M, Albughdadi M, Isa N A M. Density-based particle swarm optimization algorithm for data clustering. Expert Systems with Applications, 2018, 91: 170-186 doi: 10.1016/j.eswa.2017.08.050 [7] Wangchamhan T, Chiewchanwattana S, Sunat K. Efficient algorithms based on the k-means and chaotic league championship algorithm for numeric, categorical, and mixed-type data clustering. Expert Systems with Applications, 2017, 90: 146-167 doi: 10.1016/j.eswa.2017.08.004 [8] Qiu B Z, Cao X F. Clustering boundary detection for high dimensional space based on space inversion and Hopkins statistics. Knowledge-Based Systems, 2016, 98: 216-225 doi: 10.1016/j.knosys.2016.01.035 [9] Macqueen J. Some methods for classification and analysis of multiVariate observations. In: Proceedings of 5th Berkeley Symposium on Mathematical Statistics and Probability. Berkeley: California Press, 1967. 1(14): 281-297 [10] Bezdek J C, Robert E, Full W. The fuzzy c-means clustering algorithm. Computers & Geosciences, 1984, 10(2): 191-203 http://d.old.wanfangdata.com.cn/OAPaper/oai_doaj-articles_0bd275728f11393950d3f3b1e26d982a [11] Ester M, Kriegel H P, Xu X W, Sander J. A density-based algorithm for discovering clusters in large spatial databases with noise. In: Proceedings of the 2nd International Conference on Knowledge Discovery and Data Mining (KDD-96). Portland, Oregon: Association for the Advancement of Artificial Intelligence, 1996. 226-231 [12] Rodriguez A, Laio A. Clustering by fast search and find of density peaks. Science, 2014, 344(6191): 1492 doi: 10.1126/science.1242072 [13] Chen M, Li L J, Wang B, Chen J J, Pan L N, Chen X Y. Effectively clustering by finding density backbone based on knn. Pattern Recognition, 2016, 60: 486-498 doi: 10.1016/j.patcog.2016.04.018 [14] Huang Z X. Extensions to the k-means algorithm for clustering large data sets with categorical values. Data Mining & Knowledge Discovery, 1998, 2(3): 283-304 doi: 10.1023-A-1009769707641/ [15] Zheng Z, Gong M G, Ma J J, Jiao L C, Wu Q D. Unsupervised evolutionary clustering algorithm for mixed type data Evolutionary Computation. In: Proceedings of evolutionary computation (CEC). Barcelona, Spain: IEEE, 2010. 1-8 [16] Ji J C, Bai T, Zhou C G, Ma C, Wang Z. An improved k-prototypes clustering algorithm for mixed numeric and categorical data. Neurocomputing, 2013, 120: 590-596 doi: 10.1016/j.neucom.2013.04.011 [17] Ji J C, Pang W, Zhou C G, Han X, Wang Z. A fuzzy k-prototype clustering algorithm for mixed numeric and categorical data. Knowledge-Based Systems, 2012, 30: 129-135 doi: 10.1016/j.knosys.2012.01.006 [18] Ding S F, Du M J, Sun T F, Xu X, X Y. An entropy-based density peaks clustering algorithm for mixed type data employing fuzzy neighborhood. Knowledge-Based Systems, 2017, 133: 294-313 doi: 10.1016/j.knosys.2017.07.027 [19] 陈华, 章兢, 张小刚, 胡义函.一种基于Parzen窗估计的鲁棒ELM烧结温度检测方法.自动化学报, 2012, 38(5): 841-849 doi: 10.3724/SP.J.1004.2012.00841Chen Hua, Zhang Jing, Zhang Xiao-Gang, Hu Yi-Han. A robust-elm approach based on parzen windiow's estimation for kiln sintering temperature detection. Acta Automatica Sinica, 2012, 38(5): 841-849 doi: 10.3724/SP.J.1004.2012.00841 [20] Bryant A C, Cios K J. A density-based clustering algorithm using reverse nearest neighbor density estimates. IEEE Transactions on Knowledge & Data Engineering, 2017, PP(99): 1-1 http://ieeexplore.ieee.org/document/8240674 [21] Carvalho F D A T D, Simões E C. Fuzzy clustering of interval-valued data with cityblock and hausdorff distances. Neurocomputing, 2017, 266: 659-673 doi: 10.1016/j.neucom.2017.05.084 [22] 陈晋音, 何辉豪.基于密度的聚类中心自动确定的混合属性数据聚类算法研究.自动化学报, 2015, 41(10): 1798-1813 doi: 10.16383/j.aas.2015.c150062Chen Jin-Yin, He Hui-Hao. Research on density-based clustering algorithm for mixed data with determine cluster centers automatically. Acta Automatica Sinica, 2015, 41(10): 1798-1813 doi: 10.16383/j.aas.2015.c150062 [23] Aliguliyev R M. Performance evaluation of density-based clustering methods. Information Sciences, 2009, 179(20): 3583-3602 doi: 10.1016/j.ins.2009.06.012 [24] Žalik K R, Žalik B. Validity index for clusters of different sizes and densities. Pattern Recognition Letters, 2011, 32(2): 221-234 doi: 10.1016/j.patrec.2010.08.007 [25] UCI Machine Learning Repository[Online], available: http://archive.ics.uci.edu/ml/datasets.html, April 21, 2018 [26] Yao H L, Zheng M M, Fang Y. Adaptive density peak clustering based on k-nearest neighbors with aggregating strategy. Knowledge-Based Systems, 2017, 133: 208-220 doi: 10.1016/j.knosys.2017.07.010 [27] 周晨曦, 梁循, 齐金山.基于约束动态更新的半监督层次聚类算法.自动化学报, 2015, 41(7): 1253-1263 doi: 10.16383/j.aas.2015.c140859Zhou Chen-Xi, Liang Xun, Qi Jin-Shan. A semi-supervised agglomerative hierarchical clustering method based on dynamically updating constraints. Acta Automatica Sinica, 2015, 41(7): 1253-1263 doi: 10.16383/j.aas.2015.c140859 [28] 皋军, 孙长银, 王士同.具有模糊聚类功能的双向二维无监督特征提取方法.自动化学报, 2012, 38(4): 549-562 http://www.wanfangdata.com.cn/details/detail.do?_type=perio&id=zdhxb201204007Gao Jun, Sun Chang-Yin, Wang Shi-Tong. (2D)$.2$UFFCA: two-directional two-dimensional unsupervised feature extraction method with fuzzy clustering ability. Acta Automatica Sinica, 2012, 38(4): 549-562 http://www.wanfangdata.com.cn/details/detail.do?_type=perio&id=zdhxb201204007 [29] Du M, Ding S, Xue Y. A novel density peaks clustering algorithm for mixed data. Pattern Recognition Letters, 2017, 97: 46-53 doi: 10.1016/j.patrec.2017.07.001 [30] Zhu S, Xu L. Many-objective fuzzy centroids clustering algorithm for categorical data. Expert Systems with Applications, 2018, 96: 230-248 doi: 10.1016/j.eswa.2017.12.013 [31] Chen J Y, He H H. A fast density-based data stream clustering algorithm with cluster centers self-determined for mixed data. Information Sciences, 2016, 345: 271-293 doi: 10.1016/j.ins.2016.01.071 [32] Pan Z, Lei J, Zhang Y, Sun X, Kwong S. Fast motion estimation based on content property for low-complexity h.265/hevc encoder. IEEE Transactions on Broadcasting, 2016, 62(3): 675-684 doi: 10.1109/TBC.2016.2580920 [33] 庞宁, 张继福, 秦啸.一种基于多属性权重的分类数据子空间聚类算法.自动化学报, 2018, 44(3): 517-532 doi: 10.16383/j.aas.2018.c160726Pang Ning, Zhang Ji-Fu, Qing Xiao. A subspace clustering algorithm of categorical data using multiple attribute weights. Acta Automatica Sinica, 2018, 44(3): 517-532 doi: 10.16383/j.aas.2018.c160726 [34] Redmond S J, Heneghan C. A method for initialising the k-means clustering algorithm using kd-trees. Pattern Recognition Letters, 2007, 28(8): 965-973 doi: 10.1016/j.patrec.2007.01.001 [35] Rezaee M R, Lelieveldt B P F, Reiber J H C. A new cluster validity index for the fuzzy c-mean. Pattern Recognition Letters, 1998, 19(3-4): 237-246 doi: 10.1016/S0167-8655(97)00168-2 [36] Mehmood R, Zhang G, Bie R, Dawood H, Ahmad H. Clustering by fast search and find of density peaks via heat diffusion. Neurocomputing, 2016, 208: 210-217 doi: 10.1016/j.neucom.2016.01.102 [37] Yu S S, Chu S W, Wang C M, Chan Y K. Two improved k-means algorithms. Applied Soft Computing, 2017. http://d.old.wanfangdata.com.cn/Periodical/nygcxb201510030 -

 下载:
下载:

计量
- 文章访问数: 2696
- HTML全文浏览量: 418
- PDF下载量: 233
- 被引次数: 0
