

-
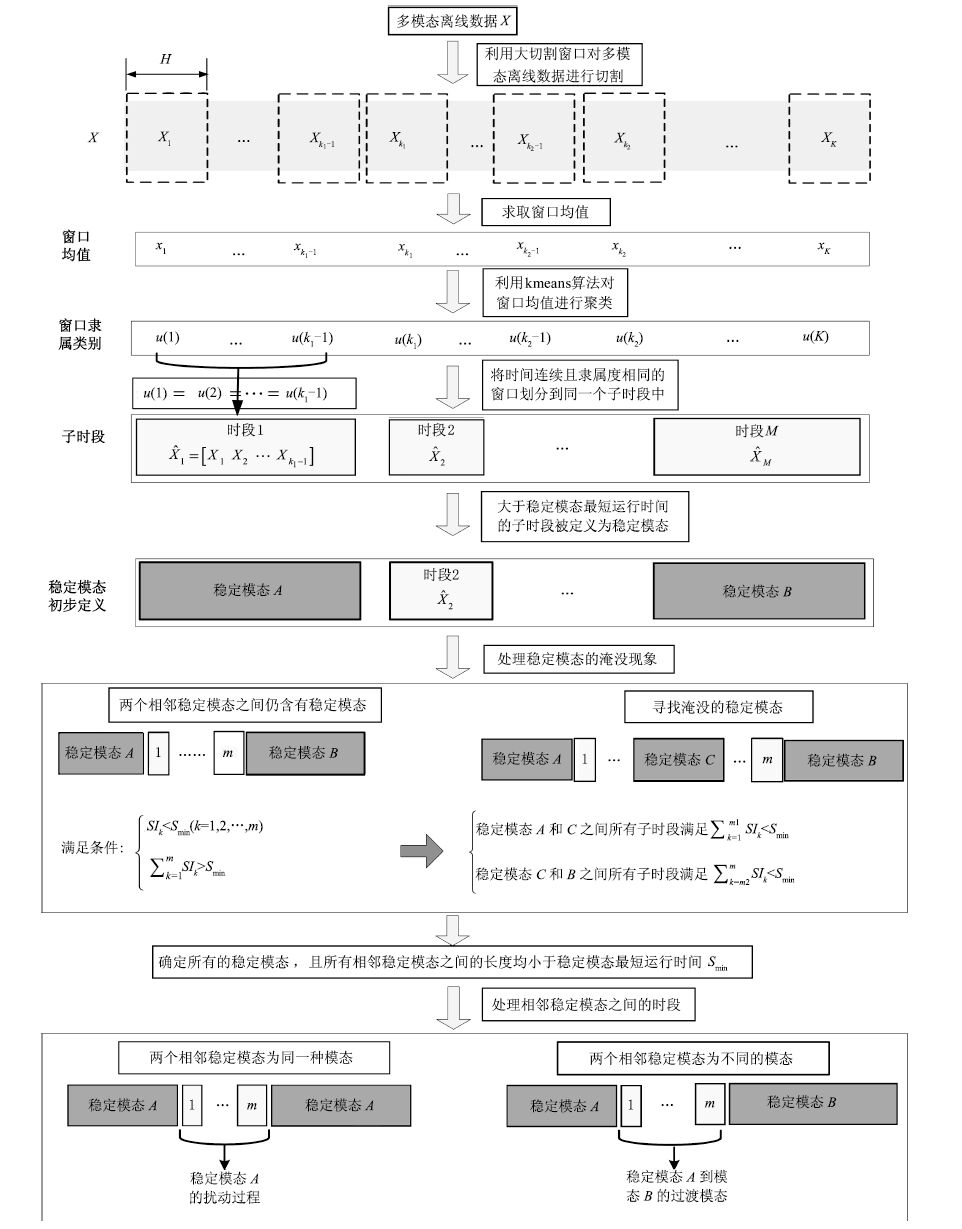
摘要: 多模态是复杂工业生产过程的普遍特性.不同模态具有不同的过程特性,需要建立不同的模型,因此离线建模数据的模态划分与识别是整个多模态过程建模的关键问题之一.目前,常用的聚类算法需要对其结果进行人工分析和后续处理,无法真正实现多模态过程的全自动模态识别.因此,本文提出一种全自动的多模态过程离线模态识别方法.首先通过宽度为H的大切割窗口对数据进行切割,利用改进的K-means聚类算法对窗口单元进行聚类;根据聚类结果,对稳定模态淹没现象进行处理,得到模态的初步划分结果;最终,利用小滑动窗口L,对稳定模态及过渡模态交接区域进行细划分,准确定位稳定模态与过渡模态的分割点.算法实现了多模态过程的全自动离线识别,并给出合理有效的识别结果.仿真分析表明此方法能够实现模态的自动识别,且识别结果准确.Abstract: Multimode is a general characteristic of complex industrial processes. Different modes have different process characteristics, and different models should be established. Therefore, offline mode identification is one of the critical problems for multimode processes modelling. Presently, the commonly used clustering methods cannot realize offline mode identification of multimode processes automatically because human analysis and further processing are needed to gain the final identification result. A fully automatic offline mode identification method is proposed in the paper. First, the data is divided into a series of data segments by a cutting window with the designated width H. The improved K-means clustering method is used to assign the segments into different clusters. According to the clustering result, the missing stable modes are dealt with to obtain the preliminary mode identification results. Finally, the regions between the stable modes and transitional modes are further analyzed by a small moving window L to determine the accurate boundaries between different modes. The mode identification of multimode processes can be realized automatically by the method for a reasonable and effective identification result. Feasibility and practical value of the method are evaluated by case study.
-
Key words:
- Mode identification /
- multi-mode process /
- transition mode /
- stable mode /
- fully automatic
-
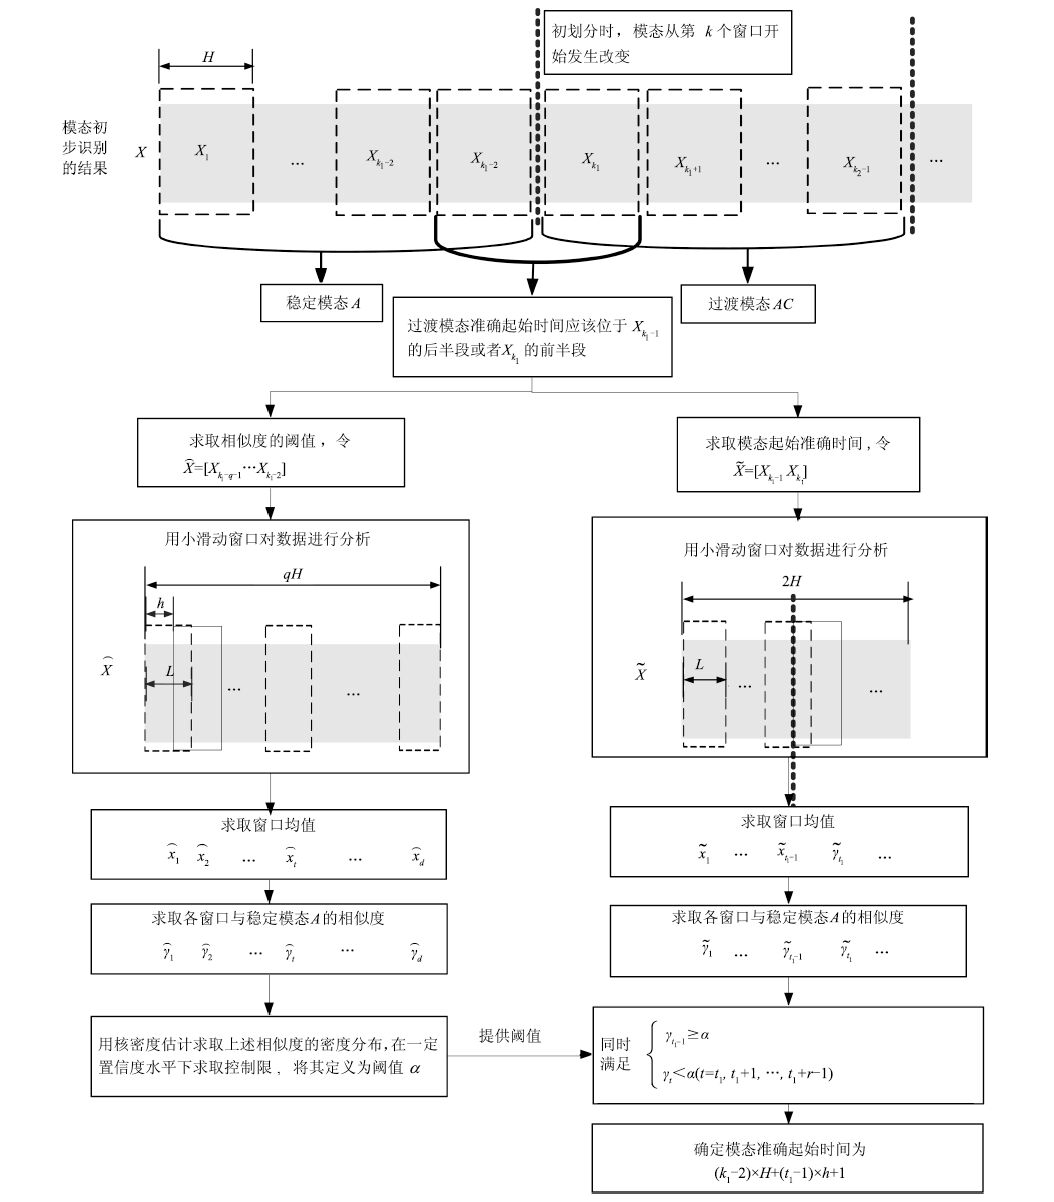
图 2 多模态准确识别过程(以 $AC$ 过渡模态起始时刻为例)
Fig. 2 Exact mode identification for multimode processes (i.e.beginning of the transitional mode $AC$ )
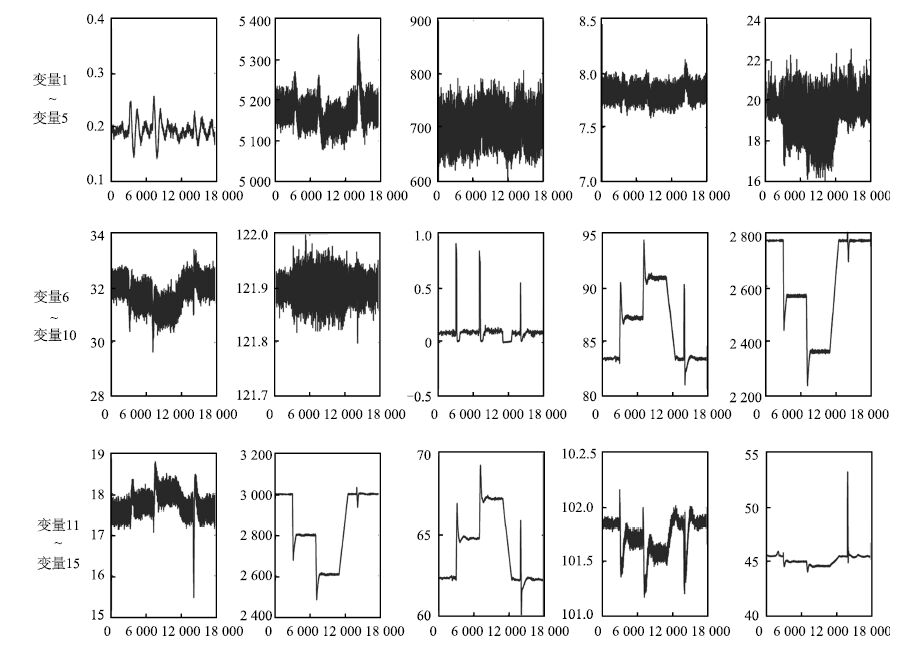
图 3 TE过程15个变量变化曲线 ( $X$ 轴表示采样点)
Fig. 3 15 variables of the TE process ( $X$ axis indicates sample points.)

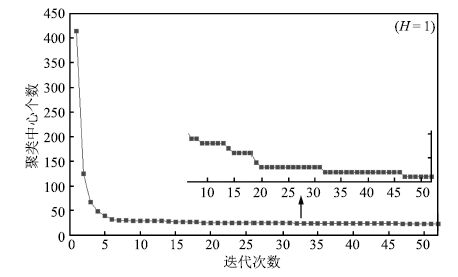
图 5 前后两次迭代聚类中心的距离( $H=1$ )
Fig. 5 Distance between clustering centers in two iterations ( $H=1$ )
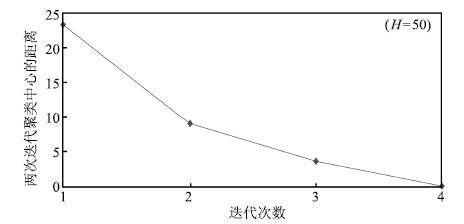
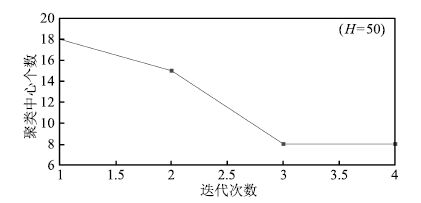
图 8 前后两次迭代聚类中心的距离( $H=50$ )
Fig. 8 Distance between clustering centers in two iterations ( $H=50$ )
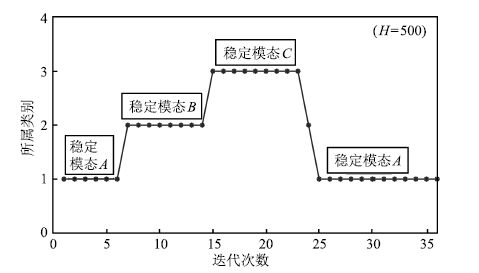
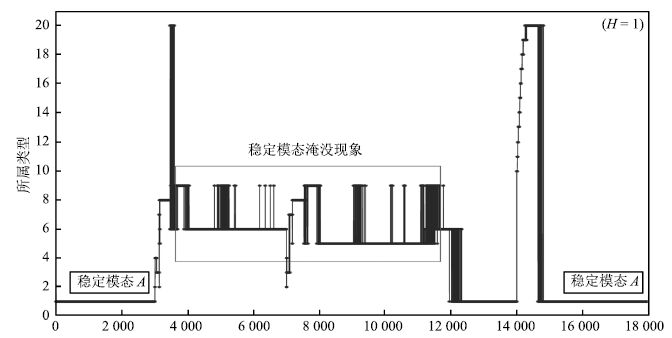
图 10 K-means算法聚类结果 ( $H=500$ )
Fig. 10 Clustering result of K-means algorithm ( $H=500$ )
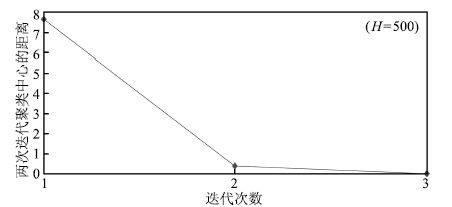
图 11 前后两次迭代聚类中心的距离 ( $H=500$ )
Fig. 11 Distance between clustering centers in two iterations( $H=500$ )
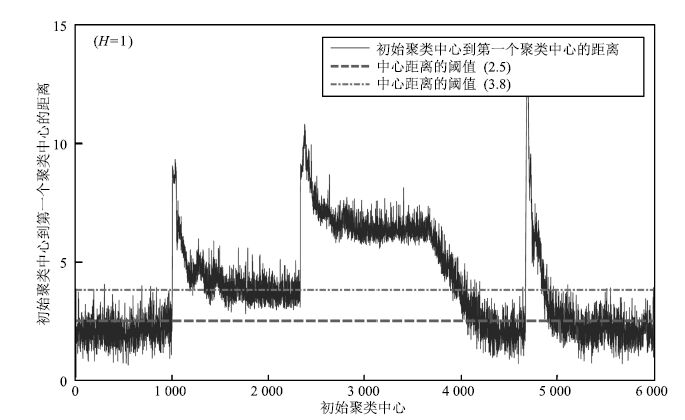
图 13 初始聚类中心到第一个聚类中心的距离( $H=1$ )
Fig. 13 Distance between original clustering center and the first clustering center ( $H=1$ )
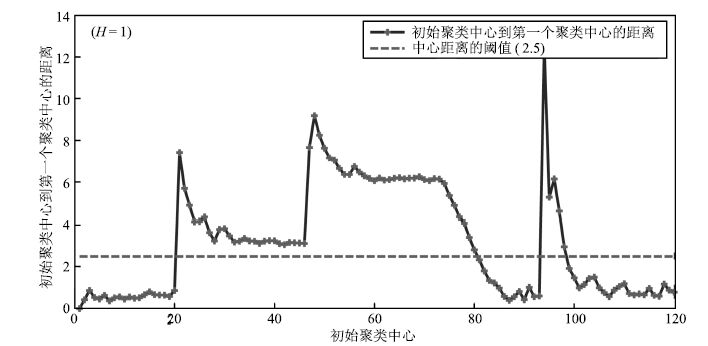
图 14 初始聚类中心到第一个聚类中心的距离( $H=50$ )
Fig. 14 Distance between original clustering center and the first clustering center ( $H=50$ )
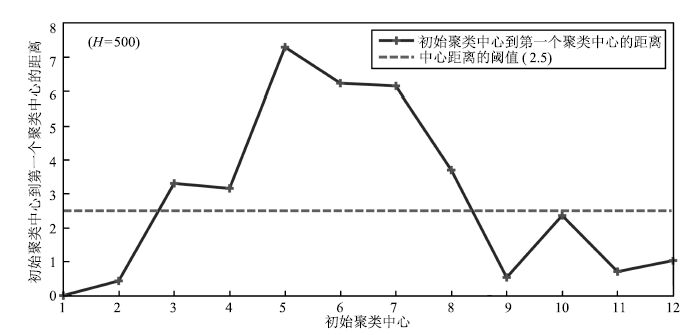
图 15 初始聚类中心到第一个聚类中心的距离( $H=500$ )
Fig. 15 Distance between original clustering center and the first clustering center ( $H=500$ )
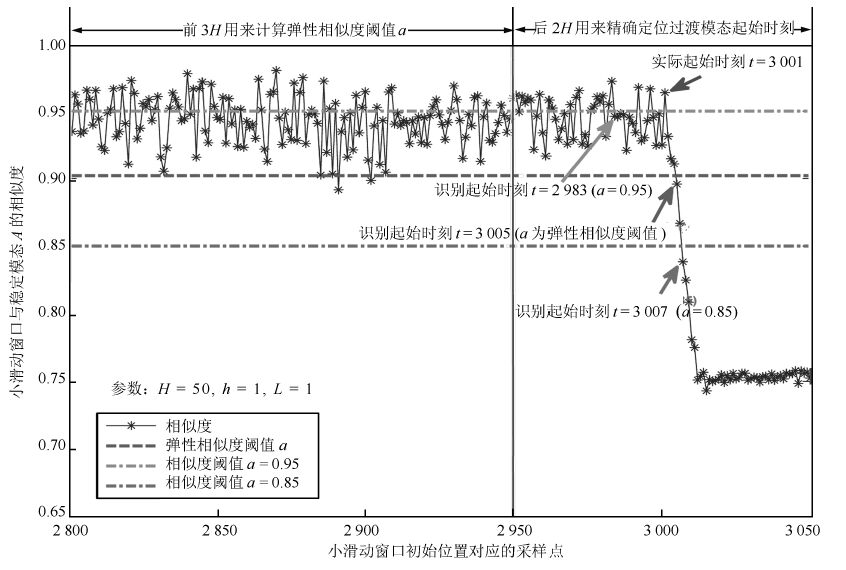
图 17 $AB$ 过渡过程起始位置识别 ( $L=1$ )
Fig. 17 Identification at the beginning of $AB$ mode( $L=1$ )
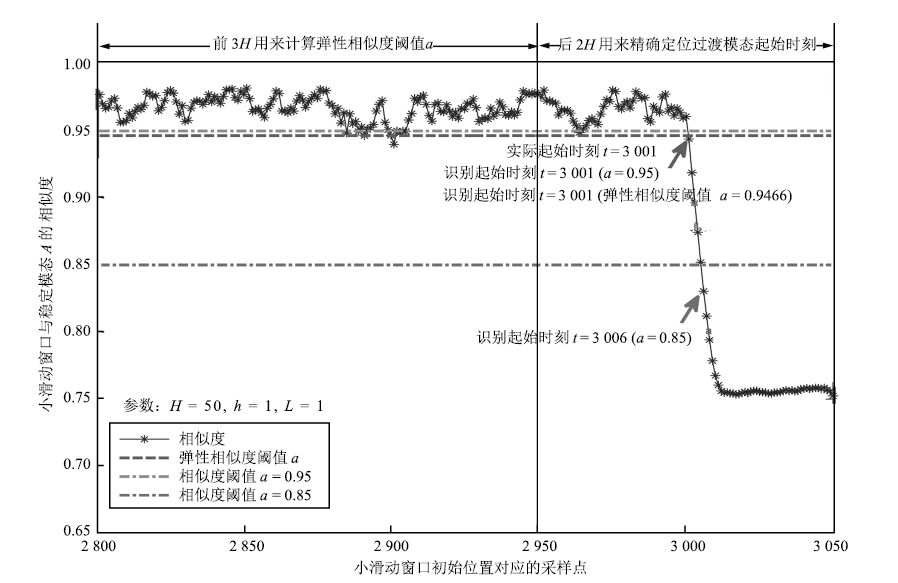
图 18 $AB$ 过渡过程起始位置识别 ( $L=5$ )
Fig. 18 Identification at the beginning of $AB$ mode( $L=5$ )

图 19 $AB$ 过渡过程终止位置识别 ( $L=1$ )
Fig. 19 Identification at the end of $AB$ mode ( $L=1$ )
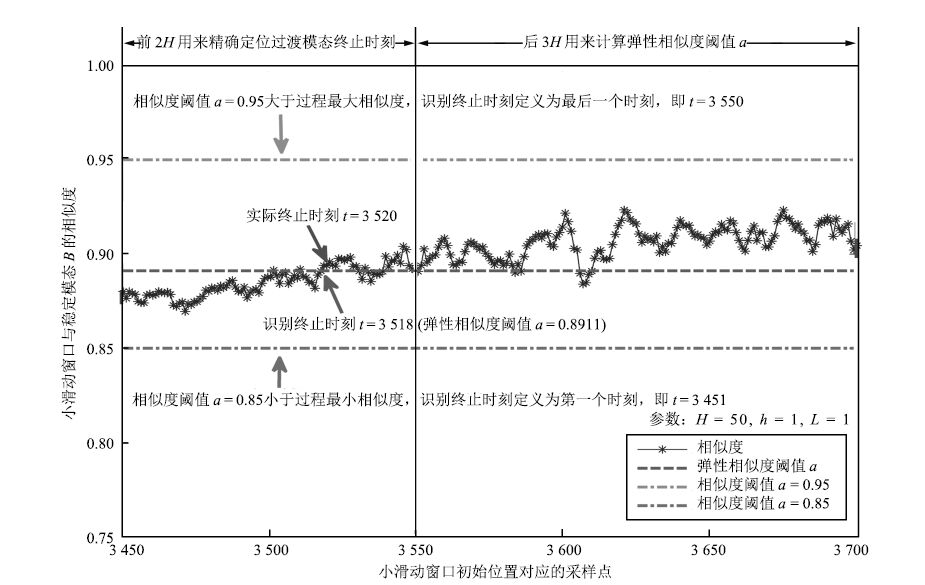
图 20 $AB$ 过渡过程终止位置识别 ( $L=5$ )
Fig. 20 Identification at the end of $AB$ mode ( $L=5$ )
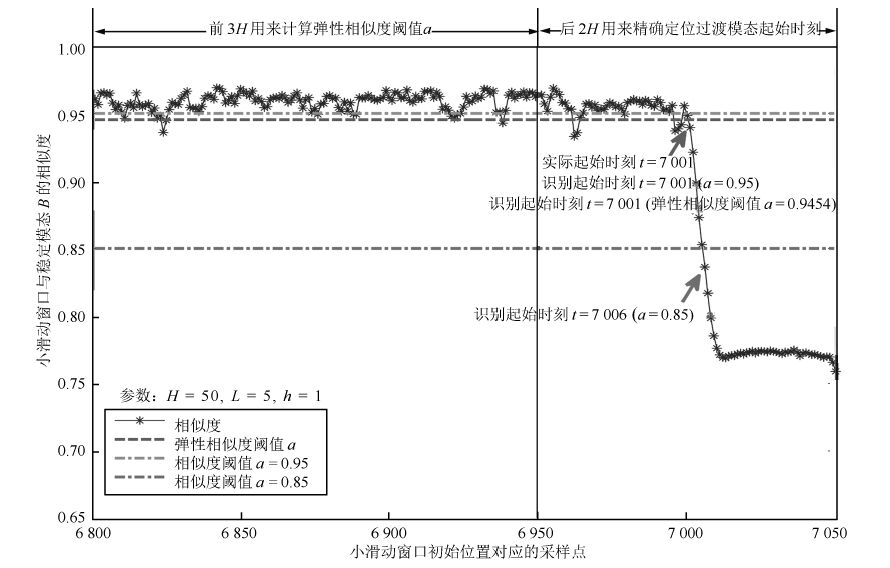
图 21 $BC$ 过渡过程起始位置识别 ( $L=1$ )
Fig. 21 Identification at the beginning of $BC$ mode ( $L=1$ )

图 22 $BC$ 过渡过程起始位置识别 ( $L=5$ )
Fig. 22 Identification at the beginning of $BC$ mode ( $L=5$ )
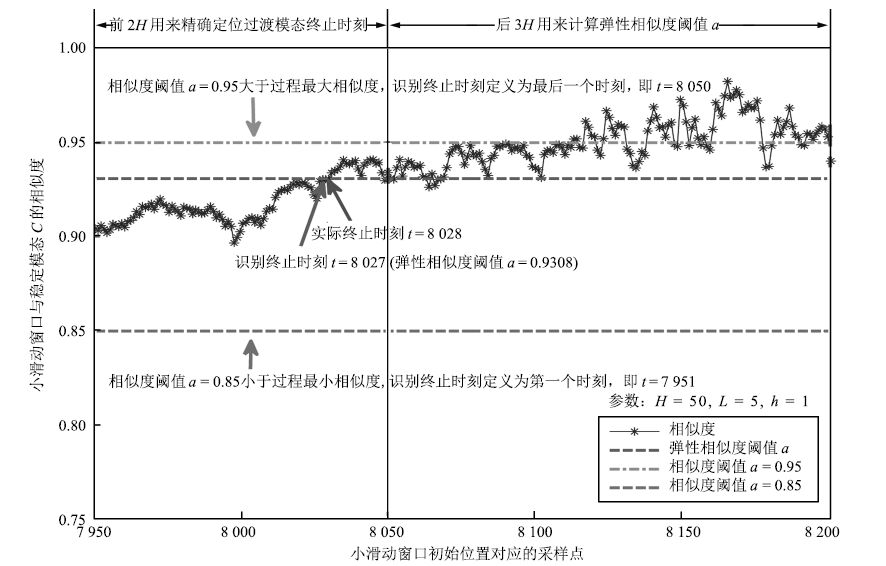
图 23 $BC$ 过渡过程终止位置识别 ( $h=1$ )
Fig. 23 Identification at the end of $BC$ mode ( $h=1$ )
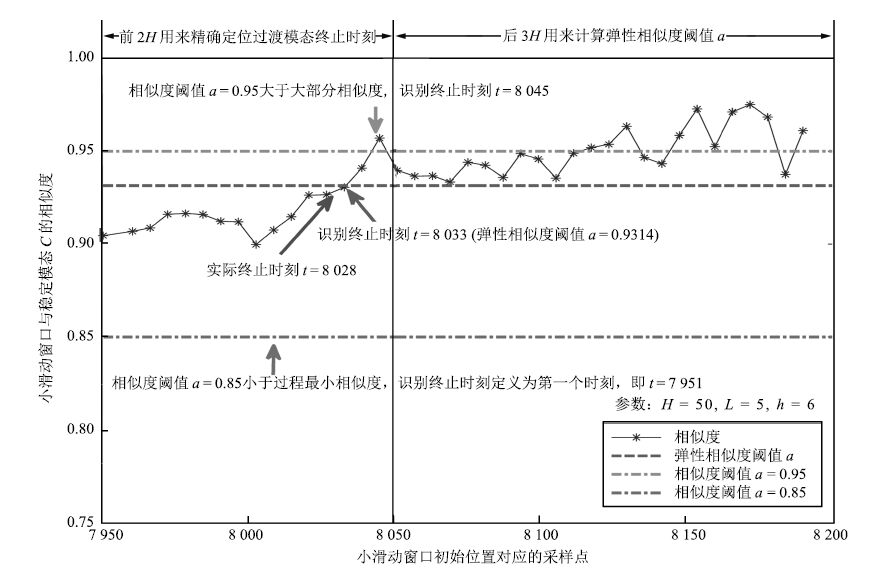
图 24 $BC$ 过渡过程终止位置识别 ( $h=6$ )
Fig. 24 Identification at the end of $BC$ mode ( $h=6$ )
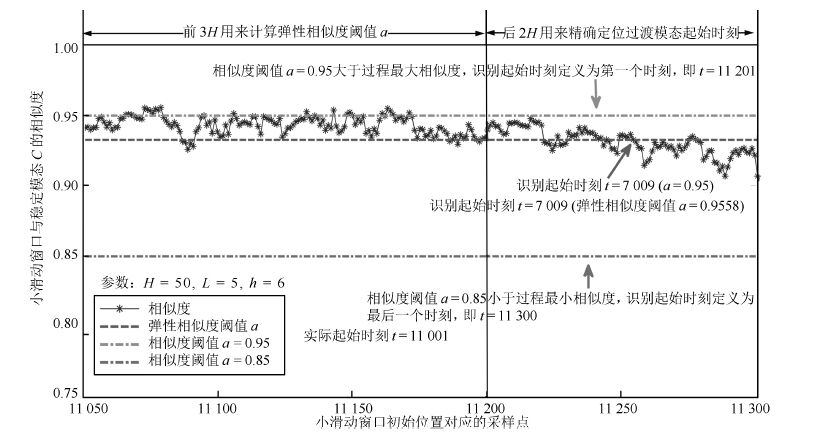
图 25 $CA$ 过渡过程起始位置识别( $L=5,h=1$ )
Fig. 25 Identification at the beginning of $CA$ mode ( $L=5,h=1$ )
表 1 TE过程操作模态列表
Table 1 Operating modes of Tennessee Eastman process
模态类型 反应器压力设定值(kPa) 反应器液位(%) 稳定模态 $A_0$ 2800 65 稳定模态 $B_0$ 2600 65 稳定模态 $C_0$ 2400 65 扰动1 2800 75  下载: 导出CSV
表 2 TE过程变量表
Table 2 Variables of Tennessee Eastman process
序号 变量名称 1 $A$ 进料量(流1) 2 $D$ 进料量(流2) 3 $E$ 进料量(流3) 4 $A,C$ 混合物料流量 5 再循环流量(流8) 6 反应器进料速度(流6) 7 反应器温度 8 排放速度(流9) 9 产品分离器温度 10 产品分离器压力 11 产品分离器塔底流量(流10) 12 汽提塔压力 13 汽提塔温度 14 反应器冷却水出口温度 15 分离器冷却水出口温度
下载: 导出CSV
表 3 TE过程实验设计
Table 3 Experimental design of TE process
模态 聚类单元 $A_0-1$ 1 $\sim$ 3000 $A_0B_0$ 3001 $\sim$ 3520 $B_0$ 3521 $\sim$ 7000 $B_0C_0$ 7001 $\sim$ 8028 $C_0$ 8029 $\sim$ 11000 $C_0A_0$ 11001 $\sim$ 12235 $A_0-2$ 12236 $\sim$ 14000 扰动 14001 $\sim$ 14720 $A_0-3$ 14721 $\sim$ 18000
下载: 导出CSV
表 4 各时段运行时间( $H=50$ )
Table 4 Runtime of each period ( $H=50$ )
时段 窗口个数 运行时间 (h) 所属类别 1 60 30 1 2 3 1.5 3 3 7 3.5 6 4 70 35 4 5 3 1.5 2 6 1 0.5 5 7 7 3.5 6 8 9 4.5 8 9 11 5.5 5 10 19 9.5 7 11 10 5 5 12 6 3 7 13 9 4.5 5 14 11 5.5 7 15 7 3.5 3 16 10 5 4 17 37 18.5 1 18 3 1.5 3 19 12 6 2 20 65 32.5 1
下载: 导出CSV
表 5 聚类结果比较(不同 $H$ 值)
Table 5 Comparison of clustering results (different $H$ )
$H$ 值 聚类单元 初始类别数量 最终类别数量 迭代次数 运行时间(s) 1 18000 6000 20 52 519.2 50 360 120 8 4 0.906 500 36 12 3 3 0.745
下载: 导出CSV
表 6 识别结果比较 (不同 $L$ 值)
Table 6 Comparison of clustering results (different $L$ )
模态 小窗口 $L$ 相似度阈值 识别位置(采样点) 识别误差(采样点) $AB$ 起始时刻 $L=1$ $\alpha=0.95$ 2983 18 $\alpha=0.85$ 3007 6 弹性阈值 $\alpha$ 3006 5 $L=5$ $\alpha=0.95$ 3001 0 $\alpha=0.85$ 3006 5 弹性阈值 $\alpha$ 3001 0 $AB$ 终止时刻 $L=1$ $\alpha=0.95$ 3550 30 $\alpha=0.85$ 3458 62 弹性阈值 $\alpha$ 3482 38 $L=5$ $\alpha=0.95$ 3550 30 $\alpha=0.85$ 3451 31 弹性阈值 $\alpha$ 3518 2
下载: 导出CSV
表 7 识别结果比较(不同 $h$ 值)
Table 7 Comparison of clustering results (different $h$ )
模态 小窗口 $L$ 相似度阈值 识别位置(采样点) 识别误差(采样点) $BC$ 起始时刻 $h=1$ $\alpha=0.95$ 7001 0 $\alpha=0.85$ 7006 5 弹性阈值 $\alpha$ 7001 0 $h=5$ $\alpha=0.95$ 7009 8 $\alpha=0.85$ 7015 14 弹性阈值 $\alpha$ 7009 8 $BC$ 终止时刻 $h=1$ $\alpha=0.95$ 8050 22 $\alpha=0.85$ 7951 77 弹性阈值 $\alpha$ 8027 1 $h=5$ $\alpha=0.95$ 8045 17 $\alpha=0.85$ 7951 77 弹性阈值 $\alpha$ 8033 5
下载: 导出CSV
表 8 TE过程识别结果
Table 8 Identification result of TE process
模态 聚类单元 模态 聚类单元 模态 聚类单元 $A-1$ 1~3 000 $BC$ 7 001~8 027 $A-2$ 12 238 ~14 000 $AB$ 3 001~3 518 $C$ 8 028~11 250 扰动 14 001 ~14 725 $B$ 3 519~7 000 $CA$ 11 251~12 237 $A-3$ 14 726 ~18 000
下载: 导出CSV
-
[1] 谭帅. 多模态过程统计建模及在线监测方法研究[博士学位论文], 东北大学, 中国, 2012.Tan Shuai. Statistical Modeling and Online Monitoring for Multiple Mode Processes[Ph.D. dissertation], Northeastern University, China, 2012. [2] Yu J, Qin S J. Multimode process monitoring with Bayesian inference-based finite Gaussian mixture models. AIChE Journal, 2008, 54(7):1811-1829 doi: 10.1002/(ISSN)1547-5905 [3] 王静, 胡益, 侍洪波. 基于GMM的间歇过程故障检测. 自动化学报, 2015, 41(5):899-905 http://www.aas.net.cn/CN/abstract/abstract18664.shtmlWang Jing, Hu Yi, Shi Hong-Bo. Fault detection for batch processes based on Gaussian mixture model. Acta Automatica Sinica, 2015, 41(5):899-905 http://www.aas.net.cn/CN/abstract/abstract18664.shtml [4] Xie X, Shi H B. Dynamic multimode process modeling and monitoring using adaptive Gaussian mixture models. Industrial and Engineering Chemistry Research, 2012, 51(15):5497-5505 doi: 10.1021/ie202720y [5] Ge Z Q, Gao F R, Song Z H. Mixture probabilistic PCR model for soft sensing of multimode processes. Chemometrics and Intelligent Laboratory Systems, 2011, 105(1):91-105 doi: 10.1016/j.chemolab.2010.11.004 [6] Ge Z Q. Mixture Bayesian regularization of PCR model and soft sensing application. IEEE Transactions on Industrial Electronics, 2015, 62(7):4336-4343 doi: 10.1109/TIE.2014.2385042 [7] Ng Y S, Srinivasan R. An adjoined multi-model approach for monitoring batch and transient operations. Computers and Chemical Engineering, 2009, 33(4):887-902 doi: 10.1016/j.compchemeng.2008.11.014 [8] Lu N Y, Gao F R, Wang F L. Sub-PCA modeling and on-line monitoring strategy for batch processes. AIChE Journal, 2004, 50(1):255-259 doi: 10.1002/(ISSN)1547-5905 [9] Zhao C H, Wang F L, Lu N Y, Jia M X. Stage-based soft-transition multiple PCA modeling and on-line monitoring strategy for batch processes. Journal of Process Control, 2007, 17(9):728-741 doi: 10.1016/j.jprocont.2007.02.005 [10] Zhao C H, Zhang W D. Reconstruction based fault diagnosis using concurrent phase partition and analysis of relative changes for multiphase batch processes with limited fault batches. Chemometrics and Intelligent Laboratory Systems, 2014, 130:135-150 doi: 10.1016/j.chemolab.2013.10.014 [11] Tang X C, Li Y, Xie Z. Phase division and process monitoring for multiphase batch processes with transitions. Chemometrics and Intelligent Laboratory Systems, 2015, 145:72-83 doi: 10.1016/j.chemolab.2015.04.007 [12] Wang F L, Tan S, Peng J, Chang Y Q. Process monitoring based on mode identification for multi-mode process with transitions. Chemometrics and Intelligent Laboratory Systems, 2012, 110(1):144-155 doi: 10.1016/j.chemolab.2011.10.013 [13] Tan S, Wang F L, Peng J, Chang Y Q, Wang S. Multimode process monitoring based on mode identification. Industrial and Engineering Chemistry Research, 2012, 51(1):374-388 doi: 10.1021/ie102048f [14] Zhang Y W, Zhang H L. Fault detection for time-varying processes. IEEE Transactions on Control Systems Technology, 2014, 22(4):1527-1535 doi: 10.1109/TCST.2013.2273498 [15] Zhang Y W, Li S. Modeling and monitoring between-mode transition of multimodes processes. IEEE Transactions on Industrial Informatics, 2013, 9(4):2248-2255 doi: 10.1109/TII.2012.2220977 [16] Alguwaizani A. Degeneracy on K-means clustering. Electronic Notes in Discrete Mathematics, 2012, 39:13-20 doi: 10.1016/j.endm.2012.10.003 [17] 潘天红, 薛振框, 李少远. 基于减法聚类的多模型在线辨识算法. 自动化学报, 2009, 35(2):220-224 doi: 10.3724/SP.J.1004.2009.00220Pan Tian-Hong, Xue Zhen-Kuang, Li Shao-Yuan. An online multi-model identification algorithm based on subtractive clustering. Acta Automatica Sinica, 2009, 35(2):220-224 doi: 10.3724/SP.J.1004.2009.00220 [18] Chiu S L. Fuzzy model identification based on cluster estimation. Journal of Intelligent and Fuzzy Systems:Applications in Engineering and Technology, 1994, 2(3):267-278 http://www.oalib.com/references/16296749 [19] Jain A K, Murty M N, Flynn P J. Data clustering:a review. ACM Computing Surveys, 1999, 31(3):264-323 doi: 10.1145/331499.331504 [20] 王惠文. 偏最小二乘回归方法及其应用. 北京:国防工业出版社, 1999.Wang Hui-Wen. Partial Least-Squares Regression-Method and Applications. Beijing, China:National Defence Industry Press, 1999. [21] 钱鹏江, 王士同, 邓赵红. 快速核密度估计定理和大规模图论松弛聚类方法. 自动化学报, 2011, 37(12):1422-1434Qian Peng-Jiang, Wang Shi-Tong, Deng Zhao-Hong. Fast kernel density estimate theorem and scaling up graph-based relaxed clustering method. Acta Automatica Sinica, 2011, 37(12):1422-1434 [22] 蒋浩天, 拉塞尔 E L, 布拉茨 R D. 工业系统的故障检测与诊断. 北京:机械工业出版社, 2003.Chiang L H, Russell E L, Braatz R D. Fault Detection and Diagnosis in Industrial Systems. Beijing, China:China Machine Press, 2003. [23] Larsson T, Hestetun K, Hovland E, Skogestad S. Self-optimizing control of a large-scale plant:the Tennessee Eastman process. Industrial and Engineering Chemistry Research, 2001, 40(22):4889-4901 doi: 10.1021/ie000586y -

 下载:
下载:


计量
- 文章访问数: 2510
- HTML全文浏览量: 437
- PDF下载量: 1190
- 被引次数: 0
